Alan Milburn’s report ‘Young people and work: interim report’ has received widespread coverage and considerable acclaim.
But this praise is misplaced. It represents the mistaken acceptance of a string of assertions on NEETs (people Not in Education, Employment or Training) that are not supported by Milburn’s own evidence. These false assertions matter because they are paving the way for a severe changes in the system of benefits for young people, which will have far-reaching consequences for them and for society in general.
This article will argue the following points:
The number of NEETs is not out of control, it is below the 25yr average (when records began)
The number has not been rising until very recently; it has been stable at a low level
Nearly 50% of NEETs don’t claim benefits, so the genuine problem of lack of work has nothing to do with benefits
Another 20% have such severe disabilities that even DWP doesn’t expect them to work
This means that 2/3rds of all NEETS cannot be affected by benefit cuts, yet this is the aim of the report
The most recent data, produced since the report, does show a rise (still well within pre-existing ranges). But this is evidence of a change in objective circumstances for youth employment and training, not any adverse change in pay, or benefits.
Chart 1. The rate of NEETs in the British economy
Fig.1 above shows the proportion of young people who are NEETs. The proportion is a more meaningful figure than recent headline-grabbing reports that the total has topped 1 million, as the number of young people has been growing over time.
What the very first chart of the report shows is that there is no new crisis of NEETs at all. If we disregard the exceptional period of lockdown the low-point for the proportion of NEETs is 11%. The high is 16.9%. The 12.8% in Milburn’s report is very far from a surge. It is actually below the long-term average.
There is another feature of the chart which is worth discussion. Milburn argues that he does not want a ‘blame game’, so barely discusses causes of the NEETs problem at all. But, accepting that there is a concern with any high level of people who could be in work, education or training and are not, then it is a glaring error to avoid discussion of causes.
Fig. 1 shows a sustained fall in the proportion of NEETs from 2011 until progress was halted in 2019. The report has nothing to say about this fall, which might be of interest to anyone addressing the issue.
Chart 2. Population of 16 to 20 year olds
Source: ONS
One of the key factors producing a rise in NEETS is simply the rise in their total, without the employment or training and education to harness their potential. Between June 2011 and June 2020 youth numbers fell by 429,000, which largely accounts for the earlier fall.
Currently there are 7.5 million 16-24 year olds in Britain. On known demographics, the Office for National Statistics projects this total will rise by 100,000 a year over the next 3 years and will then begin a gradual decline. This poses a challenge in the short-term, but the current panic over the number of NEETs is false. It is firstly a demographic blip.
However, Milburn’s report does not treat it as such, instead preferring to categorise it as a major structural problem requiring urgent remedy. But a central part of the recommended policy response will be reduced welfare available to 16-24 year olds, both in terms of eligibility for benefits and the level of support provided by those benefits. Welfare costs are cited early in the foreword to the report and mentioned 53 times in total.
But it is precisely in the area of benefits that Milburn’s report gets itself into the biggest muddle. Chart 3. Below shows NEETs by benefits status and is also taken from the Milburn report.
Chart 3. NEET young people by benefit claimant status
The first point to note is that 46% or nearly half of all NEETs are not in receipt of any benefits at all. Therefore, any policy claiming to tackle the issue of NEETs that relies primarily on benefit cuts, as Milburn suggests, is likely to fail given that any cuts will not affect nearly half of all NEETs.
That likelihood gets closer to a certainty once the second category of NEETs is considered. 20% of them have no DWP requirement to search for work at all. These are mainly people who are so severely disabled that they are exempt from searching for work. There are other categories of people under the same heading, such as women in the later stages of pregnancy.
Taking these two categories together, people not receiving benefits and those receiving benefits without a requirement look for work, amounts to 66% of all NEETs. So, two-thirds of all NEETs cannot directly be affected by any cuts to benefits in any way.
On another interpretation, Milburn intends to propose benefits cuts for young people regardless of these facts. In that case the panic over NEETs would simply be a pretext for cuts to benefits for all young people, primarily and overwhelmingly who are not NEETs.
One key consequence of any attack on young people in general or NEETs in particular is that this would fall disproportionately on young Black people. This is shown in Chart 4 below.
In summary, the evidence from the Milburn report itself is that the panic over NEETs is spurious. Milburn’s conclusions do not follow from the evidence at all. Instead, the aim to generate a panic over NEETs to launch a widespread attack on the support provided to young people in general. There is no attempt to address the causes of young people being denied education, employment or training to improve their opportunities and outcomes.
Britain is both a declining economic power and an increasingly dangerous and reckless military one, in a subordinate relationship with the United States. In that sense, it serves as an example for NATO member states to one degree or another. These two contrasting trends are economically and politically linked. An examination of them highlights important observations about key aspects of the current situation in Britain, and potentially offers insights into broader trends across the NATO bloc.
There is now a war drive underway in NATO, encouraged by Trump. This is an extension of NATO expansion that has been ongoing since 1952, and especially since the collapse of the Soviet Union. It has taken a decisive new turn under the Biden and Trump II presidencies.
As a result, there is not only growing propaganda regarding external threats, but also Trump’s demand for increased military spending by other NATO members is largely being met. Alongside this, considerable effort is being made to promote the supposed economic benefits of increased military spending. As will be shown, these claims are illusory—the economic impact of increased military spending will be the opposite of what its supporters claim. It will likely entrench Britain’s economic stagnation, or worse.
Economic Stagnation
The relative decline of British capitalism is not a new story. In 1820, Britain accounted for 9.8% of global output (Maddison data); today, it accounts for just 2.1% of world GDP (World Bank). The gradient of decline in recent years suggests that Britain’s relative economic decline is now at risk of becoming absolute. This reflects both a long-term secular slowdown and a shift into a new, lower gear of economic deceleration. The economy is approaching outright stagnation.
To illustrate: in the decade to 1965, the British economy grew by 37% in real terms. In the decade to the first quarter of 2025, it grew by just 14%, representing an annual average growth rate of little more than 1%—a trend that has persisted in recent years, excluding the effects of the COVID-19 lockdown. Aside from temporary booms such as the North Sea oil windfall (which soon turned to bust), the growth rate has been in near-continuous decline since the post–World War II recovery.
There is no mystery behind this stagnation. Britain has long maintained one of the lowest rates of investment (Gross Fixed Capital Formation, GFCF) in the G7. This has declined erratically but steadily, falling from 23% of GDP in 1970 to 17% of slowing GDP in 2024 (Office for National Statistics, ONS data). Fixed capital formation is necessary to maintain an economy’s productive capacity. Economic growth requires an increase in fixed capital formation. Since capital is consumed in the production process, the most appropriate measure of whether the stock of fixed capital (the “means of production”) is expanding or contracting is net fixed capital formation, which deducts the capital consumed from total new investment.
Prior to the Global Financial Crisis (2007–2008), Britain’s net fixed capital stock grew at an annual average rate of 2.5%, according to ONS data. Since the crisis (excluding the crash itself), this rate has slipped to 1.5%. Just as Britain’s relative economic decline has become a commonplace, so too has the widespread understanding that this is led by the decline of British manufacturing. This sectoral decline is driven by weak investment, particularly in net fixed capital formation.
Although the Bank of England and others describe the weakness in output and productivity growth as a “puzzle,” the ONS data are clear and decisive. In real terms, the manufacturing stock of fixed assets was £271 billion in 1995. By 2023, it had reached just £274 billion—barely any increase at all. The means of production in British manufacturing are not expanding. The fact that real manufacturing output has increased by just over 50% in the same 28-year period shows that there is no productivity puzzle, at least in terms of capital productivity. What is missing is growth in the real level of fixed manufacturing assets.
A Call to Arms
This structural, long-term weakness of the British economy has not been corrected by the prolonged period of austerity, which the Starmer government has continued. Manufacturing and industrial production in aggregate (which also includes energy, water, gas, and oil production), as well as GDP, have all grown at an annual average pace of 1% or less since austerity was first implemented in 2010.
Under strong pressure from Trump, the Labour government under Starmer has committed to reaching the US President’s target of spending 5% of GDP on the military among G7 countries. In reality, the figure will be somewhat lower. Widespread reports suggest that Britain, like other NATO members, will increase strictly military spending to 3.5% of GDP. The remainder will be allocated to military-related infrastructure (road and rail links, barracks, and similar projects). Much of this spending is likely to be on projects that would not otherwise have been undertaken and may be exclusively for military use, offering little utility to the productive sectors of the economy.
Military spending currently stands at 2.3% of GDP. The increase on the narrower measure will amount to a rise of 1.2% of GDP, or approximately £35 billion—an amount expected to grow over time. Announcements of increased military spending have been accompanied by a flurry of PR about the supposed economic benefits of this new expenditure, with promises that the benefits will be spread across the country. These claims are misleading. The spending will require large government outlays that yield almost nothing in terms of economic recovery. As a result, the net effect is likely to be the opposite of what its supporters claim. The British population will be worse off due to increased military spending, as resources will be diverted from other essential areas of government expenditure.
Why Military Spending Cannot Drive Economic Recovery
There are both theoretical and practical reasons for arguing that increased military spending will not lead to economic recovery. The theoretical issues will be addressed first, as they apply not only to Britain but to all countries, including the United States.
Both consumption and investment require prior production. What has not been produced—either by human labour or by nature—cannot be consumed. Likewise, investment requires production to proceed it. In Adam Smith’s famous example, investment in the creation of a pin requires digging coal, building an ironworks, smelting iron, and so on before the pin can be produced. But each of these steps—the capacity to produce coal, iron, or a factory—requires investment. Production and investment form a circular system.
There are only two broad categories for allocating production: consumption or investment. But of the two, only investment can augment the means of production. Consumption, by definition, uses up production and therefore cannot expand it.
Investment is the decisive factor in economic growth (and ultimately in prosperity, however it is shared). There is a widespread fallacy that consumption can lead to growth. But consumption is not an input to production—it is an outcome of it. Claims that consumption can “induce” or lead to growth require a mystification of the production process, where producers anticipate demand, consumption occurs, and production follows.
Under certain conditions, production can indeed be induced in this way, and it may be sensible for policymakers to attempt to stimulate it when there is spare capacity in the economy and consumption can rise to match it. But in all cases, investment in the productive capacity of the economy must occur first.
The corollary is that production is required for both investment and consumption. As investment either replaces or augments the means of production, it creates the conditions for maintaining or increasing production, which is the basis for prosperity. That increased production can then be directed either toward consumption or further investment. Therefore, while the sustainable satisfaction of human needs (consumption) is—or ought to be—the purpose of economic policy, the necessary means to achieve it is investment.
The definition of investment is that it adds to or replaces the existing means of production. Anything that increases the level of fixed assets in the economy is properly categorised as investment (Adam Smith’s term for the level of fixed assets was simply “stock”). Modern economic literature often uses a different definition of investment—an outlay for which there is a financial return. This is incorrect; it should be an economic return. There is no greater economic return from a toll road than from a road built without charges, and training a teacher for a publicly owned school is as economically productive as for a privately owned one. Either definition—financial or economic—can be used in examining military spending.
Despite the best efforts of its supporters, increased military spending is not investment. This is true even for military hardware. Missiles, bombs, and fighter jets are not additions to the means of production—they are designed to destroy it, along with human lives. Military hardware is the opposite of investment; it is the means of destruction. It is true that the production of military hardware requires a vast number of inputs from other sectors of the economy, just like Adam Smith’s pins—but on a much larger scale. This applies to all sophisticated production in a modern, advanced economy.
But there are no other parallels with productive sectors. In strict economic terms, military spending is consumption. This is because military hardware does not add to the means of production or the productive capacity of the economy. In this regard, a missile, fighter plane, or bullet is distinct from a desktop computer, lathe, or microchip. The latter can be used as inputs into the production of other goods or services; military hardware cannot.
Because it is not an input into production, military spending can only be categorised as consumption. It is not even beneficial consumption. Other items categorised as consumption—such as spending on health, education, or social welfare—are vital to the well-being of society. Not all consumption is equal. Some is essential to human development; military consumption is often wasteful or destructive.
This same point—that military spending does not constitute investment and therefore cannot contribute to growth—can also be illustrated using Keynesian economic terms in general usage.
The Military Spending Multiplier
There is an entire body of thought devoted to promoting military spending as an economic benefit, dubbed by its supporters as military Keynesianism. [1] The idea is a vulgarisation of Keynes’ work, suggesting that any type of government spending is beneficial to the economy—and given that military spending also enhances national power and prestige, it should be prioritised.
Fortunately, Keynesian economic analysis itself provides a strong rebuttal to these claims. Central to this rebuttal is the widespread assertion that military spending is jobs-rich. All types of government spending require labour inputs. Military spending is not unique in this respect, although many of its advocates rarely suggest that increased NHS spending or investment in green infrastructure creates jobs at all. Yet, since military spending does not add to the productive capacity of the economy, the labour used in the manufacture of weapons is the equivalent of Keynes’ metaphorical digging holes and filling them in again—it has zero net economic benefit.
In times of high unemployment, even digging holes and filling them in can stimulate wider job creation (which was Keynes’ ironic point). But if the aim is to create better, higher-skilled, higher-wage jobs, there are far more effective ways to spend public money.
The military budget is already one of the largest areas of government expenditure—£53 billion in 2022/23—behind only the Departments of Welfare, Health, and Education.[2] It exceeds the combined spending of the Departments of Housing, Transport, and Work & Pensions. In terms of direct employment, the Ministry of Defence employs just under a quarter of a million military and civilian staff. However, claims that military spending is jobs-rich rely heavily on assumptions about the impact of MoD procurement on job creation in private sector arms industries and related services.
It would be easy to get bogged down in technical analysis here. Thankfully, this work has already been done—in a study for the Scottish Government on employment multiplier effects. This analysis examines the structure of the economy and the relationships between inputs and outputs, including labour. It applies to individual sectors and includes detailed tables for each economic sector.[3]
The key conclusion is clear: military spending has one of the lowest employment multipliers of all economic categories. It ranks 70th out of 100 in terms of employment generated. Health ranks number 1. Sectors ranging from agriculture to energy, food manufacturing, chemicals, iron and steel, computers, and construction all have higher employment multipliers than military spending. Investment in health is two and a half times more jobs-rich than investment in the military.
A recent example illustrates this point. The British government hailed a deal with Norway to construct anti-submarine vessels, claiming it was the largest of its kind in history—worth £10 billion. Yet it was extremely vague on job creation, which can be verified. Officials stated only that the deal would secure 4,000 jobs well into the 2030s. [4] “Secure” is government-speak for no net new jobs created. A similar pattern is evident in many recent announcements about military projects. While ministers are eager to promote the supposed economic benefits of military spending, including claims about job creation across various sectors, none of the specific announcements include figures for net new jobs. There is a very good reason for this.
‘Military Keynesianism’ – A Casualty of War
The idea of military Keynesianism fell into disrepute partly because its advocates not only prioritised military spending but treated it as an exception. In no other sector of the economy did they argue that increased government spending would yield similar benefits.
The decisive turning point came in the real world, when the ideas behind military Keynesianism—and its left-wing variant, the permanent arms economy—were tested to destruction during the Vietnam War. At that time, US governments granted themselves unlimited public and covert budgets to fight the war, nearly bankrupting the federal government in the process. This also led to the collapse of the Bretton Woods economic system and unleashed a wave of global inflation.
A contrary example comes from Britain’s own history. After World War II, West Germany was not allowed to rebuild its armed forces. It was obliged to use its (much smaller) Marshall Plan funds for economic regeneration, leading to a prolonged period of public investment-led growth known as the German economic miracle. Britain, by contrast, faced no such restrictions and spent freely on the military, particularly in support of the Korean War. There was no British economic miracle. In time, Britain became known as the sick man of Europe.
In the present era, the diminished military weight of Western Europe has triggered widespread panic. In the drive to rearm, old and discredited ideas are being revived to justify the diversion of public funds—a blatant case of policy-based evidence-making. These include growing claims about the supposed positive effects of military spending on technology, R&D, and job creation. [5] As we have seen, economic theory, empirical data, and historical experience all show that these claims are not valid.
Practical Considerations, and Opposition in Practice
There are also a number of objective difficulties in implementing the policy of increasing military spending. As the character in the gangster movie says, “Blood is a big expense.” The cost—even before accounting for the toll in human lives—is twofold. First, the shift to a war economy requires significant outlays that cut across society and its existing spending priorities. Second, other forms of production must be halted or redirected toward the war effort.
NATO countries (with the exception of the United States, which has been continuously engaged in military operations since its inception) are attempting to shift to a war economy without undertaking the full, wrenching expenditure and economic redirection that such a shift entails. Either they will have to make that significant wrench, or they will fail in their aim. This tension is reflected in the discrepancy between the 5% target for total aggregate military spending and the 3.5% allocated strictly to military hardware. Additionally, it is questionable whether an increase of 1.5% annual spending on military-related infrastructure will be sufficient to accommodate an effective doubling of Britain’s military capacity remains to be seen. In any case, it will require a sustained annual commitment.
Yet there is a broader challenge beyond infrastructure investment. The required increase is nearly equivalent to Britain’s annual net public investment over the life of this parliament, as outlined in the October 2024 Budget. This challenge is magnified by the fragile state of government finances, even before meeting Trump’s demand for military spending to reach 5% of GDP. Britain has already seen three austerity-driven fiscal events under the current government: the October 2024 Budget, the Spring Statement, and the Spending Review in early 2025.
As with previous austerity packages, these measures have left both the economy and public finances in a worse state, prompting calls from austerity advocates for further tax increases and spending cuts. The traditional mantra—“there is no money left”—is not applied to military spending. But without economic growth and the resulting improvement in public finances, the government will be forced to slash other areas of spending to fund increased military outlays.
Ministers have already indicated a return to cuts in welfare spending, which previously triggered parliamentary rebellions within the Labour Party and imposed a heavy political cost on the current leadership. The Office for Budget Responsibility (OBR) estimates that total government spending will amount to 45% of GDP in the current financial year. The planned increase in military spending demanded by Trump will amount to 2.7% of GDP—an enormous rise.[6]
Clearly, this cannot be funded by cutting military spending or avoiding debt interest payments. Together, these already account for 6.2% of GDP (OBR data). For political reasons, the government has ruled out touching the state retirement pension. Altogether, these commitments total 13.9% of GDP. The increase in military spending must therefore come from the remainder—namely, spending on health, education, public services, and welfare. A series of ministerial statements suggest that welfare payments are the primary target. But given the depth of the fiscal crisis, little else has been ruled out. In effect, disabled people, the poor (including the low-paid), and pensioners will bear the cost of the war drive. In his latest statement, Starmer added that those suffering from mental health conditions would also be affected.
However, there is notable resistance. This was most evident in the parliamentary rebellion over cuts to disability payments, where the government was forced into a series of concessions that angered austerity advocates but still led 47 Labour MPs to vote against their own government.
There is a media furore every time it is hinted that the government may be forced to retreat on planned welfare cuts. The demand to cut welfare is the demand to cut the social wages and thereby lower wages in general. The demand to increase military spending fits with the new political priorities of the US-sponsored drive to war.
Perhaps the most significant resistance came from the recent Trade Union Confederation (TUC) conference. This was significant not only because of the social forces involved, but also because of the direct link made between military spending and welfare cuts. Reversing its previous support for immediate increases in military spending (based on job creation claims), the TUC voted to prioritise campaigning for public investment in services and to “reaffirm our movement’s priority is welfare and wages, not weapons and war.” The vote was close: 2,871,000 in favour, 2,291,000 against.
No one expects the TUC to campaign vigorously on this issue, but the vote leaves the door open for individual unions to work with the wider movement to advocate for the policy. It is highly unusual—but not unprecedented—for the organised labour movement to oppose the key war aims of both the British and US governments, especially under a Labour government. In opposing the Suez War, the National Council of Labour (the TUC and Labour combined) aligned with the US. The first real cracks in union support for Britain’s central war aims came during the Iraq War. The latest TUC vote builds on that legacy.
In Britain and many other NATO countries, there is much talk of public investment. But the reality is different. The announcement from Chancellor Rachel Reeves, following the Treasury’s Spending Review, stated that there would be £725 billion in public investment over the next 10 years. But this is less per year than the £77.6 billion invested in 2024. Public investment is being cut. Once the (smaller) envelope for public investment is set, that then determines the level of funding available for consumption.
Just as in the domestic economy, investment + consumption must equal 100% of output, so public investment + public consumption must account for 100% of public spending.
The inescapable logic is that the government must choose between types of consumption within the reduced funds allocated to it. The Starmer government has made its choice: it cut international aid and welfare to increase military spending. Cutting welfare once more and even reducing painfully low state retirement pensions are now openly discussed.
Essentially, under the current allocation for public consumption, the government chose between welfare funding and military funding. Economically, politically, and morally, it made the wrong choice. Other Western governments have made similar decisions.
Living standards are declining in Britain and across Europe. Commentators note the growing divergence in real incomes between rich and poor in the United States, with European countries now at risk of following that example. Therefore, the material basis for opposition to reckless, wasteful military spending may continue to grow.
The above article was originally published in Polish here by Nasze Argumenty.
[1] Paul Krugman, “Weaponized Keynesianism,” The New York Times (blog), June 24, 2009, archived at https://archive.nytimes.com/krugman.blogs.nytimes.com/2009/06/24/weaponized-keynesianism/
[2] “Public Spending Statistics: February 2024,” GOV.UK, published 28 February 2024, https://www.gov.uk/government/statistics/public-spending-statistics-release-february-2024/public-spending-statistics-february-2024
[4] Jonathan Beale and Jessica Rawnsley, “UK Secures £10bn Deal to Supply Norway with Warships,” BBC News, August 31, 2025, https://www.bbc.co.uk/news/articles/cr5rgdpvn63o
[5] “Higher Defence Spending Could Create Up to 200,000 Jobs in Germany, Says Report,” The Brussels Times, February 17, 2025, https://www.brusselstimes.com/eu-affairs/1447802/higher-defence-spending-could-create-up-to-200000-jobs-in-germany-says-report
The following article, which shows the sharply rising proportion of fixed investment in the economy in the 250 years since the Industrial Revolution, was written in the context of a specific discussion of China’s economy. This is the claim that China invests too high a proportion of its economy. As the article shows, on the contrary, China’s approximately 40 percent of gross fixed investment/gross fixed capital formation in GDP is merely the latest stage of a process that has been going on for over two centuries. Such a deep process has, of course, profound implications for economic policy—as the article analyzes.
However, the data in this article relates to more general theoretical issues as well as the specific discussion of China. The rising proportion of the economy used for investment is one of the most central predictions of Marx’s Capital—or, as he terms it, the “rising organic composition of capital.” Such a rising proportion of investment in the economy was, less systematically, also predicted by Adam Smith, and by, for somewhat different reasons, by John Maynard Keynes. The attempt by Milton Friedman to refute this was found to be erroneous, even by neoliberals, thanks to modern econometric studies, as discussed below.
In light of this, it is therefore rather astonishing that attempts have been made to refute Marx on the rising organic composition of capital by some of those who claim to be presenting Marx. These critics argue that there is no reason why the proportion of investment in the economy should rise, and that subsequent theoretical work has shown that there is a pattern of technological change between the two sectors (wage goods and means of production) that can keep the ratio of consumption and investment steady in perpetuity.
Such claims mean that, from a theoretical viewpoint, such authors do not understand Marx’s economics. That, however, can be dealt with in a separate article. For present purposes, the issue is one of facts: the rising proportion of investment in the economy is a factual question that can be measured.
In Marx’s analysis, constant capital consists of two parts—circulating capital, which, in modern Western economics, would be termed “intermediate products,” and fixed investment. Factual studies confirmed that the most rapidly growing component of the economy is intermediate products/circulating capital. Thus, for example, in the United States, Jorgenson, Gollop and Fraumeni found: “the contribution of intermediate input is by far the most significant source of growth in output. The contribution of intermediate input alone exceeds the rate of productivity growth for thirty-six of the forty-five industries.”[1]
The same result is found for other economies, including China. For South Korea, Hak K. Pyo, Keun-Hee Rhee, and Bongchan Ha found that regarding intermediate inputs, “the relative magnitude of contribution to output growth is in the order of: material, capital, labor, TFP then energy.”[2] For Taiwan Province of China, analyzing twenty-six sectors in 1981–99, Chi-Yuan Liang found regarding intermediate material inputs were “the biggest contributor to output growth in all sectors during 1981–99, except…seven.”[3] For mainland China, Ren and Sun found that, from 1981 to 2000, subdivided into 1984–88, 1988–94, and 1994–2000, “intermediate input growth [was] the primary source of output growth in most industries.”[4]
However, although the evidence is that circulating capital/intermediate products rises more rapidly than both GDP growth and fixed investment, nevertheless, the facts are clear that there is historically a massive increase in the proportion of fixed investment in the economy—from around 3 percent of GDP in Britain at the time of the Industrial Revolution to 40 percent of GDP in China today. That is, there is also a massive increase in the proportion of the production of means of production in the economy. The facts show a massive increase in the organic composition of capital with economic development. Therefore, not only is it theoretically erroneous that some claiming to represent Marx align themselves with Friedman against Marx, Smith, and Keynes; more importantly, their claims are also entirely against the economic facts.
The data in the article below, which was originally published in Chinese by Guancha, therefore extends beyond the specific issue of China’s current development, to fundamental economic theories of development. Marx’s analysis of the rising proportion of the economy used for investment—that is, the rise of the proportion of the economy used for production of means of production—is one of his greatest achievements and entirely confirmed by 250 years of economic development, including by the 150 years since Marx accurately predicted it.
–John Ross
China’s very high level of investment reflects the historically advanced character of its economy
Accurate analysis of the role of investment in economic development is decisive for China, as it is for every country. The facts that follow confirm this. This applies not only to short-term economic policy but still more clearly to economic strategy—therefore, in particular, to China’s achievement of its goals for 2035 and 2049.
A false claim, a myth, however, is put forward in some sections of the Western media which attempt to obscure such an accurate assessment. This is the claim that China invests too high a proportion of its economy because its level of investment in GDP is much higher than that of Western countries. But in reality, as will be seen, the entire historical period of development since the Industrial Revolution—that is, since the creation of modern economies—has seen progressively higher ratios of investment in GDP. Each successive period has, in turn, been associated with higher economic growth rates. The facts show that China’s high level of investment is simply the latest stage of an international process of economic development that has been underway for over two centuries.
Once this fundamental historical trend is understood, it becomes clear that China’s higher investment rate relative to Western economies is not a problem for China’s economy. On the contrary, it reflects its historically advanced economic structure. China’s gross fixed investment accounts for approximately 40 percent of its economy, whereas the United States’ is only slightly over 20 percent. In the even more important measure of net fixed investment, which takes into account depreciation, China invests 16 percent of its GDP, whereas the United States invests only 5 percent.
As the historical trend below demonstrates, the reason for the difference between China and Western economies is that the level of investment in Western economies is too low for the present global historical stage of economic development. This results in slow growth and consequent social and political instability. In contrast, China’s higher level of investment reflects that it is today the leading part of a process that has been going on since the Industrial Revolution.
The conclusion of this article will consider the implications of this historical trend of the rising proportion of investment in the economy, the faster growth rates that it gives rise to, analysis of the reasons for this trend, and the latter’s policy implications. It will be seen that this trend of the rising percentage of investment in GDP is entirely as predicted by Marx’s analysis of the increasing organic composition of capital—that is, the increasing capital intensity of production.
First, however, before analyzing the implications and following the method of “seeking truth from facts,” the data regarding the historical trend of the rising proportion of the economy used for investment will be clearly established.
Both historical and short-term analyses of the role of investment are consistent
Earlier articles by the present author on these issues used relatively sophisticated econometric methods to analyze the extremely close relation between investment and economic growth over relatively short time frames.[5] This was necessary because, during short time frames, economic growth may be affected not only by the most powerful long-term structural trends that determine an economy’s strategic development, but also by many purely short-term conjunctural fluctuations—business cycles, the impact of non-economic events, and so on. To use an analogy: in examining a short timeframe, it is difficult to distinguish the “signal” from the “noise,” necessitating the use of precise statistical methods to identify the underlying trend amid short-term fluctuations.
In this article a different, simpler method is used to show the clear trend of the rising proportion of investment in the economy. Over long timeframes, short-term, non-fundamental, peripheral, and secondary fluctuations have little effect, and only the most powerful processes dominate, allowing them to be clearly seen without the need for sophisticated econometric techniques. It is therefore hoped that this article, which requires no advanced statistical methods, will make clear to non-specialist readers the fundamental facts regarding the historically rising share of the economy allocated to investment.
It should be made clear, however, that these immediately visible trends neither replace nor contradict the statistical methods used in short-term studies. On the contrary, the two arrive at precisely the same conclusion. The longer-term historical studies provide the context within which the shorter-term processes operate.
The fundamental historical trend
To outline the most fundamental trend first, before considering individual countries in detail, Figure 1 shows the percentage of fixed investment—gross fixed capital formation, to be precise—in GDP in the lead economies in each period of economic development in the approximately 250 years since the Industrial Revolution. The “lead economy” is the major economy which had the fastest rate of economic growth during successive historical periods of economic development—that is, the economy which represented the growth frontier of these successive historic periods.
Figure 1
Figure 1 immediately makes clear that in each successive period, the lead economy had a higher proportion of fixed investment in the economy than the previous one—it will also be shown that each lead economy had a higher sustained growth rate than the previous one.
These lead growth economies, in successive chronological order of their development, were Britain; the United States; West Germany; Japan and South Korea; and China.
As Figure 1 shows, each of these successive lead economies had a higher level of investment in the economy than the one before. This began with Britain, with investment of about 3 percent of GDP at the time of the Industrial Revolution, then rising to 10 percent by the 1830s, followed by gross fixed capital formation of slightly over 20 percent in the United States after the Civil War, then 30 percent in postwar West Germany, over 35 percent in Japan and South Korea, and rising to slightly over 40 percent in China today.[6] It is therefore clear that China’s high level of investment is simply the continuation of a process which has been taking place for 250 years since the Industrial Revolution.
The increasing rate of economic growth
Turning to the growth rates accompanying these increasingly high percentages of fixed investment, the successively faster economic growth rates in each of these periods are shown in Figure 2.
As what is important for fundamental economic development is sustained growth rates, not unsustainable and purely short-term spurts, long-term growth rates are considered here. To be able to make an exact comparison with China since the beginning of Reform and Opening Up, what is considered in each case is the maximum total economic growth achieved over a forty-six-year period during a country’s period of global economic growth leadership (i.e., a period equivalent to China’s growth in 1978–2024). In descending order of growth rate, which is also reverse chronological order, China’s is the fastest, then South Korea, then Japan, then West Germany, then the United States, then the United Kingdom.
Figure 2
Table 1 summarizes these growth rates, showing both the total growth over a forty-six-year period of each of these lead economies and its annual average growth rate during that period. Thus, during its period of global growth leadership, the United Kingdom, the first country to experience the Industrial Revolution and create a modern economy, achieved 2 percent average annual growth, the United States achieved 4.8 percent, West Germany 5.3 percent, Japan 6.4 percent, South Korea 8.4 percent, and China 8.9 percent.[7]
The relation between this percentage of fixed investment in GDP shown earlier and the rate of growth is, of course, one to one. That is, the higher the percentage of fixed investment in GDP the faster the rate of economic growth. In terms of historical development, each historical period saw both a higher level of fixed investment in GDP and a higher rate of GDP growth than the one before.
This data therefore makes very clear that what has been taking place is a 250-year process since the Industrial Revolution of an historically increasing percentage of fixed investment in GDP and an increasingly fast rate of economic growth with progressive economic development. China’s level of investment in GDP (the highest of any major lead economy) and its fast growth rate (the most rapid of any major economy in human history) are therefore not an aberration, but simply the latest stage of this 250-year-long process.
Having shown the overall historic process, each of these lead economies will now be considered in detail—culminating with China.
Table 1 46-year GDP Growth Period China data is 1978–2024. Other states are maximum 46-year growth period after they became the leading growth economy
Britain: The first industrial economy
Britain, the first economy to achieve industrialization, raised its level of investment from around 3 percent of GDP on the eve of the Industrial Revolution to 10 percent by the 1830s (see Figure 3), achieving an economic growth rate of 2.3 percent by the end of this period.[8]
Figure 3
During the 18th century and the beginning of the 19th century, Britain experienced economic acceleration, accompanied by introduction of radical new technologies and an increase in the percentage of fixed investment in GDP. [9] By the beginning of the 1820s, Britain had become the largest Western economy (i.e., excluding China and India), but with a per capita GDP almost four times that of China or India.[10] By this process Britain became the first modern industrial state and the world’s most advanced economy.[11]
The percentage of investment in England’s GDP was rising, initially extremely slowly, from the earliest periods for which data exists.[12] The most detailed recent study concludes: “the fixed investment ratio fluctuated at a low level of one to two per cent during the medieval period, increasing to between 2 and 4 per cent during the early modern period. However, the major change was the sharp increase from the mid 18th century, reaching 10 per cent by the early nineteenth century.”[13]
Britain’s economic growth was rapid by Western European standards even before the Industrial Revolution.[14] But the Industrial Revolution saw a qualitative acceleration. Taking ten-year periods to eliminate the effect of purely short-term fluctuations: by the 1780s, British annual GDP growth had reached 1.6 percent, and by the 1830s, 2.3 percent.[15] This secured the United Kingdom’s lead position in the world economy, already analyzed.
This rising trend in the share of gross fixed capital formation in the UK from the Industrial Revolution to 1950 is shown in Figure 3. The increase in the percentage of investment in GDP—a tripling or quadrupling, depending on the calculation made about the initial starting point—was of course enormous for this historical period, but only achieved a low level compared to later historical development.
In summary, from the 1760s to the 1830s, essentially covering the period of the Industrial Revolution, taking ten-year annual averages, Britain increased its percentage of investment in GDP from 3.3 percent to 10.5 percent and increased its annual average economic growth rate from 0.6 percent in 1700–60 to 2.3 percent. This established Britain as the leading economic state of the world.
The fact that Britain’s domestic investment did not progress beyond approximately 10 percent of GDP for a century from the 1830s then played a decisive role in Britain’s being overtaken by the United States as the world’s leading economy, as will be seen in the next section.
The United States overtakes the United Kingdom
The United States of course overtook Britain during the 19th century to become the leading international economy. The United States showed the next step upward in both the percentage of investment in GDP and the economic growth rate.
At the time of Britain’s Industrial Revolution, the United States was not among the world’s largest economies.[16] In 1775, Britain’s economy was almost 6 times larger than that of the United States.[17] Economic historians differ on the immediate development of the U.S. economy after independence, but by 1820, the most recent estimate is that the U.S. economy was still only 38 percent the size of the United Kingdom’s.[18] However, by 1840, the U.S. economy was already more than half the size of the United Kingdom’s, and by 1850, it was 73 percent, with a higher growth rate as well as a higher level of investment in GDP.[19] By the 1840s, therefore, the United States was already the most rapidly growing major economy; further U.S. economic acceleration after the Civil War was a continuation of this process. For that reason, the date of the United States’ becoming the major lead economy globally in terms of growth is taken here as dating from the 1840s—although it will be shown that taking a later date, for example, after the Civil War, makes no difference to the essential pattern. In terms of total GDP, the United States overtook Britain in the 1860s or 1870s, and by 1900, its total GDP was almost double that of the United Kingdom.[20]
Estimates for gross investment as a percentage of the U.S. economy are, unfortunately, not available for the period of the onset of Britain’s Industrial Revolution—they only become available in current prices from the period 1839–1848. By then, the U.S. level of investment already exceeded the UK: the share of gross national capital formation in U.S. GDP was 14 percent. During the course of the 19th century, the percentage of fixed investment in U.S. GDP rose sharply, eventually far surpassing that of Britain. U.S. gross capital formation oscillated between 14 percent and 16 percent of GNP until 1858, the eve of the Civil War. After the Civil War, this level then rose rapidly to far exceed the UK level. By 1869–78 the U.S. level was 19 percent of GDP; by 1879–1888, 21 percent; and by 1888-98, 23 percent (see Figure 4, which compares the United States and the United Kingdom).[21] This historically unprecedented U.S. investment boom, which had no equal in world history until that time, particularly following the Civil War, transformed the American economy.[22]
Figure 4
In summary, the United States surged to global leadership based on a level of investment in GDP that at that time had no precedent in world history. The advantage of the United States over other economies in fixed investment continued for a prolonged period. As Maddison notes: “The rate of U.S. domestic investment was nearly twice the UK level for the sixty-year period 1890–1950. Its level of capital stock per person employed was twice as high as that of the United Kingdom in 1890, and its overwhelming advantage in this respect over all other countries continued until the early 1980s.”[23]
As a result, from 1840 to 1950, the United States grew at an average annual rate of 3.9 percent—over 50 percent higher than the rate of British GDP after the latter had accelerated following the Industrial Revolution. [24]
The approximate level of fixed investment reached after the U.S. Civil War, slightly over 20 percent of GDP, with only a short-term catastrophic collapse during the Great Depression, was sustained, and still existed in the United States 140 years later, in the 2020s. The fact that, after far surpassing its British rival by the late 19th century, the United States did not increase its investment-to-GDP ratio for nearly a century and a half is crucial for explaining numerous trends in the modern world, as will be analyzed below.
For approximately a century, in particular from the end of the Civil War to the immediate aftermath of the Second World War, the U.S. level of investment of slightly over 20 percent of GDP was the highest of any major economy and the United States was the world’s most rapidly growing major economy. From 1850 to 1950, the average annual GDP growth rate of the United States was 3.8 percent, Germany and Japan 1.7 percent, and the United Kingdom 1.6 percent.
The cumulative effect of such growth rates sustained for almost a century was overwhelming in establishing U.S. dominance. From 1850 to 1950, the U.S. economy increased in size by 3,880 percent, Japan’s by 460 percent, Germany’s by 450 percent, and the United Kingdom’s by 370 percent (see Figure 5).
Figure 5
With total growth over eight times as great as any major competitor, laying the base for defeating both Germany and Japan in the world wars, the economic dominance of the United States in the period up to 1950 was crushing.
West Germany becomes the first major advanced economy to overtake the U.S. growth rate
Given this U.S. growth dominance for over a century, it was therefore a crucial historic development after the Second World War that, for the first time, a series of major economies began to see levels of investment of significantly over 20 percent of GDP, i.e., above the U.S. level, and achieved more rapid economic growth than the U.S.
The first of these economies was West Germany. By 1955 West Germany had achieved a level of gross fixed capital formation of 26.5 percent of GDP, above the U.S. level, and by 1964 this rose to 30.5 percent (see Figure 6). The United States then launched a major counteroffensive against Germany in the 1960s and 1970s, particularly with U.S. abandonment of the convertibility of the dollar to gold and the end of the Bretton Woods currency system in 1971.[25]
Figure 6
From 1950 to 1971, West Germany achieved an average annual GDP growth rate of 5.9 percent—the first time in history a major economy had grown faster than that of the United States over a sustained period. Despite the sharp fall in the percentage of investment in West German GDP after 1971 and a deep fall in its growth rate, West Germany/Germany still outgrew the United States with a 5.3 percent annual average growth rate during this period, due to West Germany’s very high level of fixed investment, in the forty-six-year period from 1946 to 1992.
The fast-growing East Asian capitalist economies
The second major economy after West Germany to achieve a higher level of fixed investment in GDP and a far higher growth rate than those of the United States was Japan. Japan achieved an even higher percentage of fixed investment in GDP, and a faster growth rate, than West Germany. By 1960 Japan’s gross fixed capital formation was 33.2 percent of GDP and by 1971 it was 37.5 percent (see Figure 7). As with West Germany, Japan was also struck by the U.S. counteroffensive in 1971 as U.S. abandonment of dollar-to-gold convertibility led to a sharp decline in Japan’s percentage of investment in GDP and a sharp economic deceleration. Japan, however, became the first economy to achieve a level of investment of over 35 percent of GDP and over a 46-year period, its annual average GDP growth rate was 6.4 percent.
Figure 7
From the late 1970s onward, Japan’s level of fixed investment was matched by the so-called Asian Tigers: South Korea, Singapore, Hong Kong, and Taiwan Province of China. As South Korea is the largest of this group, it will be analyzed in detail.
Starting from an extremely low level of fixed investment in GDP in the early 1950s, by 1979 South Korea’s level of gross fixed capital formation in GDP had reached 35 percent (see Figure 8). This similar pattern of Japan and the Asian Tigers formed what might be termed the “East Asian rapid capitalist growth model.” In 1997 South Korea was struck by another U.S. counteroffensive in the form of the East Asian debt crisis, in the same way that West Germany and Japan had been struck in 1971.This led to a fall in the percentage of fixed investment in South Korea’s economy and a sharp decline in its growth rate.[26] Nevertheless, South Korea’s annual average GDP growth, during its most rapid forty-six-year period of growth, was 8.4 percent.
Figure 8
Socialist China
From 1978, with Reform and Opening Up and the construction of a socialist market economy, China attained the fastest rate of growth of any major economy in history. China’s level of gross fixed capital formation in GDP reached over 40 percent of GDP (see Figure 9), and its annual average growth rate from 1978 to 2024 was 8.9 percent.
Figure 9
This extremely high level of fixed investment in GDP and very fast growth rate differentiate China’s economy from Western economies today. However, it is entirely clear from the preceding data that China’s level of investment and growth rate is neither an “aberration” nor a “miracle” but simply the latest and most advanced stage of a process of the rising share of investment in the economy—that is, of the rising organic composition of capital—that has been taking place for over 250 years since the Industrial Revolution.
Conclusions
As stated at the beginning, the aim of this article is to make clear the historical process of the rising proportion of investment in the economy. It does so by taking the entire period of economic development since the Industrial Revolution, without the need to use sophisticated statistical techniques to separate powerful long-term processes from purely short-term shifts. Doing so has made clear that China’s high level of investment in GDP is merely the latest stage in an historical process which has been taking place for more than two centuries.
Because this is such a deep-rooted economic process, one confirmed by short-term studies and entirely consistent with the predictions of economic theory, it is clear that this historical trend will not stop with China’s current development. In the future, economies will develop that will invest more than 40 percent of GDP. The only issue is whether China will continue to lead this historical process or if another economy will do so. That, in turn, will be determined by China’s own policy choices.
Numerous consequences follow from this historically rising proportion of investment in the economy. For reasons of space, only a few of the most important can be summarized here; others will be dealt with, or have already been dealt with, in separate articles.
Clearly, there is no ambiguity as to the trend of the rising proportion of investment in the economy with historical development. This trend was predicted by Adam Smith, particularly analyzed by Marx (as the rising organic composition of capital), and again predicted by Keynes. While this article, for reasons already stated, has examined an extremely long historical period, this factual conclusion of the rising proportion of fixed investment in the economy is confirmed even by those opposed to both Marx and Keynes and who consider different timeframes.
For example, Barro (who, together with Lucas and Sargent, is one of the founders of New Classical Macroeconomics and of the theory of rational expectations) surveyed trends since 1870. He arrives at exactly the same conclusions: “For the United States, the striking observation…is the stability over time of the ratios for domestic investment and national saving…. The United States is, however, an outlier with respect to the stability of its investment and saving ratios; the data for the other…countries show a clear increase in these ratios over time. In particular, the ratios for 1950–89 are, in all cases, substantially greater than those from before World War II. The long-term data therefore suggest that the ratios to GDP of gross domestic investment and gross national saving tend to rise as an economy develops.”[27]
In short, despite Barro’s overt opposition to Keynes and his attempt to totally ignore Marx, he is forced to arrive at the same economic conclusions as outlined above.
This more than 250-year historical pattern confirms the clear positive correlation between the percentage of investment in GDP and the rate of economic growth—that is, an increasing proportion of investment in the economy is accompanied by rising economic growth rates. The historical trend shown above is consistent with the strong positive correlation in large economies between the percentage of fixed investment in GDP and the economic growth rate during the most recent periods.[28]
The fact that systematic measures of net fixed capital formation, as opposed to only gross fixed capital formation, are available for more recent economic periods simply means that modern studies establish this extremely strong positive correlation between the percentage of fixed investment in GDP and the economic growth rate still more clearly than the long-term historical studies used here. For large economies, the recent correlation between the percentage of net fixed capital formation in GDP and the economic growth rate is over 0.9, i.e., as close to a perfect correlation as will be found in any real economic process.[29]
This strong positive historic correlation between the percentage of fixed investment and economic growth is entirely that which would be predicted by economic theory. This is because capital is an input into the production function in both Western and Marxist economic theory.[30] Therefore, increasing the proportion of the economy used for investment, by increasing inputs of fixed capital, would be predicted to increase the economic growth rate—precisely as confirmed by both historical and short-term studies.
The obverse of this positive correlation between the percentage of fixed investment in GDP and the economic growth rate is that the lower the percentage of fixed investment in GDP, the slower will be the economic growth rate. This is entirely confirmed by the facts.[31]
The consequences of raising the level of consumption in GDP are therefore clear. As investment plus consumption constitutes 100 percent of the domestic economy, increasing the percentage of consumption in GDP, because it necessarily means reducing the proportion of investment, will slow economic growth. Arguments in favor of increasing the proportion of consumption in China’s GDP are therefore, in fact, arguments in favor of slowing China’s rate of economic growth.
Furthermore, because there is an extremely strong positive correlation between the rate of growth of GDP and the rate of growth of consumption, an argument for increasing the percentage of consumption in GDP, by reducing the economic growth rate is, in fact, an argument in favor of slowing the rate of growth of consumption/living standards. This is why there exists a factual negative correlation between the percentage of consumption in GDP and the growth rate of consumption—that is, the higher the percentage of consumption in GDP, the lower will be the growth rate of consumption.[32]
This fact—that increasing the percentage of consumption in GDP leads to slower GDP growth—is in line with economic theory. Consumption, by definition, is not an input into production. Therefore, raising the percentage of consumption in GDP, which necessarily lowers the percentage of investment in GDP, means replacing something which is an input into production (investment) with something which is not an input into production (consumption). Lowering inputs into production necessarily lowers the economic growth rate. As the growth rate of consumption is strongly positively correlated with the GDP growth rate, lowering the rate of economic growth necessarily lowers the consumption growth rate.
From the viewpoint of verifying or falsifying economic theories, the historical data clearly and entirely confirms Smith’s, Marx’s, and Keynes’s conclusion that the percentage of fixed investment in GDP rises with economic development. Referring to investment as part of constant capital, Marx noted that “this law of the progressive increase in constant capital, in proportion to the variable, is confirmed at every step.”[33] Marx’s analysis, developed in the 1860s at a time when, compared to the present day, the level of fixed investment was very low, and which therefore predicted almost over 150 years of economic development, is clearly a work of historical genius. It is also a strong confirmation of Xi Jinping’s analysis that “our study of political economy must be based on Marxist political economy and not any other economic theory.”[34]
These economic facts clearly affect the type of stimulus programs which are required in China. The trends outlined above are fundamental and strategic—i.e., medium to long-term ones. They do not contradict the fact that, to deal with shorter-term economic fluctuations, consumer stimulus may be required. But strategically the rate of China’s economic growth depends on its high level of investment. Short-term stimulus must fit with this economic strategy.[35]
Increasing capital intensity of production is a key foundation of Justin Yifu Lin’s New Structural Economics (NSE). It is clear from the historical data given above, from shorter-term studies considered elsewhere, and from the factual studies carried out even by anti-Marxist and anti-Keynes economists, that this foundation stone of NSE is correct. That is, the historical development of production, and the advance to more developed stages of economic production, is one of increasing capital intensity of production. This confirms that NSE is entirely consistent in this respect with the economic facts and the conclusions on this reached by Smith, Marx and Keynes. Any theory which, unlike NSE, does not arrive at a conclusion of the rising capital intensity of production with economic development is not in line with the facts.
Finally, why are obviously correct things rejected?
But all these facts raise an obvious question. That investment rises as a proportion of the economy with economic development is unequivocally confirmed by historical data, by short-term studies (even by anti-Marxist and anti-Keynes analysts), and by economic theory. Why, therefore, are attempts made to deny this entirely clear fact? And why are attempts made to deny their practical consequences for China?
The first is conscious and unconscious Western arrogance. Factual comparison of economies immediately reveals that the structure of China’s economy, in terms of the level of investment, is different to that of a Western economy. But China’s annual average economic growth is around 5 percent and that of the United States is slightly above 2 percent. Any objective judgement, therefore, would logically conclude that China’s structure was superior to the West’s in producing economic growth.
But seeing that China’s economic structure differs from the West’s, Western commentators are immediately led to the entirely illogical conclusion that it must be China’s economic structure, not the West’s, which is the problem! Instead, the fact that China’s level of investment is much higher than that of Western economies should logically lead to the conclusion: Yes, of course, China is different. Of course China does not correspond to the average. Because China’s is a much more rapidly growing economy than the West. If China had the same economic structure as the West, then it would slow down to the same low speed as the West! The problem is therefore not China’s high level of investment, with its fast growth rate. China is just the latest stage in a process which has been going on for 250 years, since the Industrial Revolution, of a rising proportion of the economy which is used for investment.
China’s economy generates more rapid economic growth and more rapid growth of consumption. The problem is with the Western economies, which have fallen behind the historical trend of the rising percentage of investment in GDP and are therefore trapped in slower growth.
But Western arrogance means it is impossible for them to understand or admit that it is China’s investment level which is superior, and the continuation of a fundamental trend of economic development, and it is the Western economies which are falling behind.
An example: The illogicality of Goldman Sachs
To take a precise example: Goldman Sachs projects that China’s GDP growth will fall sharply to an average 3.4 percent in 2023–32. The reason for this alleged slowdown is because the annual increase in GDP growth created by capital investment is projected to fall by 2.4 percent. And, in turn, the reason for this predicted sharp slowdown is that, Goldman Sachs argues, China’s level of investment in its economy will fall sharply: “Investment as a share of GDP is forecast to decline from 42 percent in 2022 to 35 percent by 2032.”
The reason this will happen is allegedly because China’s level of investment is higher than other economies at a similar level of development. China is at present an upper middle-income economy, although approaching the level of a high-income economy, by World Bank standards, and “investment as a share of GDP in upper-middle-income countries is 34 percent.” Thus, it is argued that China should reduce its level of investment and slow down to the growth rate of other economies.
Why on earth should China do this? China is producing a more rapid increase in average living standards than these Western economies, it is creating more rapid economic growth, it has produced a more rapid reduction in poverty than they have, and so on. The economy with the most rapid economic development is, of course, different from countries with slower economic development. But China is different precisely because it is in line with a trend in economic development, which has been occurring for over two centuries,
A comparison will make the ridiculousness of the argument, and the unconscious Western arrogance, clear. Suppose a company wanted to enter a new industry and asked Goldman Sachs for advice, and Goldman Sachs reported: “In this industry one company is clearly growing much more rapidly than the others. Therefore, you should not learn from this more rapidly growing company, you should copy the more slowly growing companies.” Everyone would laugh at such a proposal—just before they cancelled the contract with Goldman Sachs. But in terms of country-level comparisons, that is exactly what is being proposed.
The only reason the absurdity of these arguments is not immediately clear is the conscious and unconscious arrogance of Western analysts, which makes them think that if there is a difference between China and the West, it must be the West which is correct, even if the objective evidence is to the contrary. That this is Western arrogance is transparently obvious, because the purely economic arguments are so fallacious and contrary to the facts of historical development.
Conclusion
China’s high level of investment is not an aberration. It is the latest stage of an economic process which has been taking place for 250 years since the Industrial Revolution. It is a sign of the historically advanced character of China’s economy, and its development, in a specific national situation, is in line with historical trends.
Notes
[1] Jorgenson, Gollop, and Fraumeni 1987, 200. More precisely, Jorgenson, Gollop, and Fraumeni found: “The contribution of intermediate input is by far the most significant source of growth in output. The contribution of intermediate input alone exceeds the rate of productivity growth for thirty-six of the forty-five industries for which we have a measure of intermediate input…. If we focus attention on capital and labour inputs, excluding intermediate input from consideration, we find that the sum of contributions of capital and labour inputs exceeds the rate of productivity growth for twenty-nine of the forty-five industries for which we have a measure of productivity growth…the predominant contributions to output growth are those of intermediate, capital and labour inputs. By far the most important contribution is that of intermediate input.”
[2] Pyo, Rhee, and Ha, 2007.
[3] Liang 2007.
[4] Ren & Sun, 2007.
[5] See for example 从210个经济体大数据中,我们发现了中国和世界经济增长的密码 https://www.guancha.cn/LuoSiYi/2024_10_05_750743.shtml.
[6] If shorter time periods were used, the Soviet Union would be included because of its rapid growth in the 1930s—its 6 percent annual average growth from 1929 to 1939 was the fastest of any major economy (calculated from Maddison, 2010). This was accompanied by an internationally unprecedented increase in the share of investment in GDP: “the share of gross investment in the national product (measured at 1937 ruble factor cost) went up from roughly 12 per cent in 1928 to nearly 26 per cent in 1937” (Erlich, 1967). However, Soviet longer-term economic growth was greatly reduced by the catastrophic losses during the Second World War. In the immediate postwar period, Soviet economic growth was again fast, but not as fast as Japan—so the Soviet Union can only be considered the global growth leader in the 1930s.
[7] If the starting data of 1968 is taken then, due to the fall in GDP during the Cultural Revolution of the late 1960s, China’s growth rate would be even higher. However, to avoid any suggestion of artificially increasing rates, here only China’s growth from 1978 onwards is considered.
[8] As Britain was the first modern industrial economy, the processes leading to its early development have been intensively studied. There is debate among historians as to the exact dating of the onset of the Industrial Revolution, of detailed estimates of its economic growth rates, and the percentage of fixed investment in GDP during it—also whether it should be best described as a “revolution” or rather as a more gradual cumulative process. But for present comparative historical purposes, these differences are inconsequential, since all estimates are so low by the standards of a modern economy that they clearly indicate the subsequent historical trend.
[9] In terms of technology, individual examples of what constituted advanced machinery for that period began to be introduced from the early 18th century—machinery being fixed investment. The Newcomen steam engine, the first steam-powered pump, was introduced in 1712, the flying shuttle was introduced in 1733, and the first spinning machine was introduced in 1764. The beginning of the development of steam-powered railways, which required a significantly higher level of capital expenditures, began from 1804. Systematic introduction of machinery into textile production, considered the technological commencement of the Industrial Revolution, began in the last third of the 18th century. Railway construction, entailing a further significant increase in fixed investment, began soon after the start of the 19th century.
[10] Calculating from the data in Bolt and Zanden 2020, measured in 2011 PPPs, the United Kingdom’s GDP in 1820 was 70 billion, compared to 57 billion for France, 51 billion for what became Italy, 50 billion for what became Germany, and 27 billion for the United States. Per capita GDP for the United Kingdom in 1820 was 3,306 compared to 882 for China, a ratio of 3.7:1.
[11] Detailed figures for Britain from the most recent comprehensive studies are used here, but alternative estimates would not alter the qualitative trend relative to subsequent developments.
[12] This process began to occur even before the capitalist revolution of 1642–49, and the sharp increase that occurred during the Industrial Revolution. The percentage of fixed investment in GDP is estimated to have risen from about 1.8–1.9 percent of GDP around 1300 to approximately 2.5 percent of GDP by 1760 as the Industrial Revolution commenced (Broadberry and Pleijt 2021, Figure 5). Strikingly, and equally in line with Marx’s analysis, the proportion of fixed capital relative to working capital also rose during this period.
[13] Broadberry and Pleijt 2021, 23. In detail, the earliest data analysed to obtain a realistic account of the structure of the British economy date from 1688, shortly before the systematic introduction of advanced machinery. The first systematic estimates of investment as a percentage of British GDP during the early phase of this process of industrialization ranged from 2.5 percent to 5 percent, but more recent studies have tended to lower that figure still further (Broadberry and Pleijt 2021). The percentage of domestic investment in British GDP (“Domestic investment = fixed investment + stockbuilding” (Broadberry and Pleijt 2021, 36) then began to rise much more rapidly, from 3.3 percent in the 1760s to 7 percent in the 1790s, then fell slightly during the period surrounding the Revolutionary and Napoleonic Wars with France, before rising again to 7.5 percent in the 1830s, and reaching 10.5 percent by the 1840s (see Figure 4). It then failed to rise significantly above this level for almost one hundred years. The data for the period of the Industrial Revolution is from Broadberry and Pleijt 2021.
[14] Britain had an average annual economic growth rate of 0.6 percent between 1600 and 1700, compared with a Western European average of 0.2 percent – calculated from (Maddison, 2010). Broadberry, Campbell, Klein, Overton, and van Leeuwen 2015 gives a slightly higher estimate of British economic growth in 1600–1700 (0.7 percent), but does not provide a comparable estimate for Western Europe for the same period.
[15] Broadberry, Campbell, Klein, Overton, and van Leeuwen 2015, 199, Table 5.03.
[16]Leaving aside China and India, the largest economies globally after Britain in this period were those of France and what would later become Germany and Italy.
[17] For the U.S. interpolating the data of (U.S. Census Bureau., 1975.) for 1770 and 1780 gives a population of 2.5 million, while (Maddison Project, 2023) gives a GDP per capita in 2011 PPPs of 2,419—giving a total GDP of 6.0 billion. For the UK (Bank of England, 2024) gives the population of Great Britain as 8.21 million while calculating from the data of (Gráda, 1979) gives a population of 4.0 million, while (Maddison Project, 2023) give a per capita GDP of 2,895— a total GDP of 35.4 billion.
[18] Lindert and Williamson 2012, Table 4 shows a decline in 1840 constant dollar prices of per capita real incomes, from $85.26 in 1774 to $68.22 in 1800—i.e., a drop of 20 percent, implying a sharp economic contraction. However, Maddison Project 2023, based on calculation from McCusker and from Sutch 2006 gives, in 2011 PPPs, U.S. per capita GDP of $2,419 in 1775 of and $2,545 in 1800, which implies an extremely slow 0.2 percent annual increase averaged over the period. “38 percent the size of the United Kingdom’s”: calculated from Maddison Project 2023.
[19] Calculated from Maddison Project, 2023.
[20] Calculated from Maddison Project 2023, it was 96 percent higher.
[21] Gallman and Rhode 2020, Table 1.3
[22] From 1868 to 1892, 115,960 miles of railways were constructed—four times the total investment in railway construction and equipment compared to the period from 1840 to 1870. Capital per manufacturing establishment more than doubled from $8,400 in 1870 to $18,400 in 1890 (U.S. Census Bureau 1975.)
[23] Maddison 1991, p. 40.
[24] Calculated from Johnston and Williamson 2025.
[25] For a detailed analysis of this process, see 它曾成功“谋杀”了德国、日本、四小龙,现在想要劝中国“经济自杀.”
[26] See 它曾成功“谋杀”了德国、日本、四小龙,现在想要劝中国“经济自杀.”
[27] Barro and Sala-i-Martin 2004, 40.
[28] See, for example, 从210个经济体大数据中,我们发现了中国和世界经济增长的密码.
[29] See 从210个经济体大数据中,我们发现了中国和世界经济增长的密码.
[30] For a more detailed analysis of this see 误读提振消费策略,对中国应对美国竞争非常不利. In a Marxist production function, it is part of constant capital, which, with living labor, is one of the two inputs into production, and in “Western” economics, it is, with living labour and total factor productivity (TFP), one of the determinants of production.
[31] For detailed statistics on this, see 从210个经济体大数据中,我们发现了中国和世界经济增长的密码 and 误读提振消费策略,对中国应对美国竞争非常不利.
[32] For the detailed data on this, see 罗一和吉塞拉·塞尔纳达斯:从210个经济体大数据中,我们发现了误解促消费对经济的危害 and 误读提振消费策略,对中国应对美国竞争非常不利.
[33] Marx 1867, Chapter 25: The General Law of Capitalist Accumulation.
[34] Xi 2020.
[35] For a detailed formal analysis of this, see, in particular, Yu Yongding’s 消费驱动还是投资驱动?
Bibliography
Bank of England. (2024, August). A Millennium of Macroeconomic Data for the UK. Retrieved from bankofengland.co.uk: https://www.bankofengland.co.uk/statistics/research-datasets
Barro, R. J., and Sala-i-Martin, X. (2004). Economic Growth (Kindle Edition). Cambridge, MA: MIT Press.
Bolt, J., and Zanden, J. L. (2020). Maddison style estimates of the evolution of the world economy: A new 2020 update (Maddison-Project Working Paper WP-15. Retrieved from https://www.rug.nl/ggdc/historicaldevelopment/maddison/releases/maddison-project-database-2020
Broadberry, S., and Pleijt, A. d. (2021, February 27). Capital and Economic Growth in Britain, 1270-1870: Preliminary findings. Retrieved from University of Warwick: https://warwick.ac.uk/fac/soc/economics/research/centres/cage/publications/workingpapers/2021/capital_and_economic_growth_in_britain_1270_1870_preliminary_findings/
Broadberry, S., Campbell, B., Klein, A., Overton, M., and van Leeuwen, B. (2015). British Economic Growth, 1270– 1870. Cambridge: Cambridge University Press.
Erlich, A. (1967). Development Strategy and Planning: The Soviet Experience. Retrieved from http://www.nber.org/chapters/c1425
Gallman, R. E., and Rhode, P. W. (2020). Robert Gallman’s Capital Stock Project. In R. E. Gallman, and P. W. Rhode, Capital in the Nineteenth Century. University of Chicago Press. Retrieved from https://www.nber.org/books-and-chapters/capital-nineteenth-century
Gráda, C. Ó. (1979). The population of Ireland 1700-1900: a survey. Annales de démographie historique,, pp. 281-299. Retrieved from https://www.researchgate.net/publication/291613400_The_population_of_Ireland_1700-1900_a_survey
Johnston, L., and Williamson, S. H. (2025, October 21). What Was the U.S. GDP Then? Retrieved October 21, 2025, from MeasuringWorth.com: https://www.measuringworth.com/datasets/usgdp/
Jorgenson, D. W., Gollop, F. M., and Fraumeni, B. M. (1987). Productivity and US Economic Growth. New York: toExcel.
Liang, C.-Y. (2007). “Industry-Wide Total Factor Productivity and Output Growth in Taiwan, 1981–1999.” In D. W. Jorgenson, M. Kuroda, and K. Motohashi (Eds.), Productivity in Asia: Economic Growth and Competitiveness (pp. 146-184). Cheltenham: Edward Elgar.
Lindert, P., and Williamson, J. (2012). American incomes 1774–1860 (Working Paper No. 18396). National Bureau of Economic Research. Retrieved from https://doi.org/10.3386/w18396
Maddison Project. (2023). Maddison Project Database 2023. Retrieved from 10.34894/INZBF2
Maddison, A. (1991). Dynamic Forces in Capitalist Development. Oxford, UK: Oxford University Press.
Maddison, A. (2010). Statistics on World Population, GDP and Per Capita GDP, 1-2008 AD. Retrieved from Angus Maddison (1926-2010): http://www.ggdc.net/MADDISON/oriindex.htm
Marx, K. (1867 Chapter Twenty-Five: The General Law of Capitalist Accumulation). Karl Marx. Capital Volume One. Retrieved from https://www.marxists.org/archive/marx/works/1867-c1/ch25.htm
Marx, K., and Engels, F. (1845 (1976 Edition)). The German Ideology. In K. Marx, and F. Engels, Karl Marx, Frederick Engels Collected Works Vol.5 (1976 ed., Vol. 5, pp. 19-539). Moscow: Progress Publishers.
McCusker, J. F. (n.d.). Colonial Statistics. In S. S. S. B. Carter, Historical Statistics of the United States: Earliest Time to the Present. New York: Cambridge University Press.
Pyo, H. K., Rhee, K.-H., and Ha, B. (2007). “‘Growth Accounting and Productivity Analysis by 33 Industrial Sectors in Korea (1984-2002)’. In D. W. Jorgenson, M. Kuroda, and K. Motohashi (Eds.), Productivity in Asia: Economic Growth and Competitiveness (pp. 113-145). Cheltenham: Edward Elgar.
Ren, R., and Sun, L. l. (2007). Total Factor Productivity Growth in Chinese industries, 1981-2000. In D. W. Jorgenson, M. Kuroda, and K. Motohashi (Eds.), Productivity in Asia, Economic Growth and Competitiveness (pp. 76-112). Cheltenham: Edward Elgar.
Sutch, R. (2006). National Income and Product. In S. B. Carter, S. S. Gartner, and M. R. Haineset, Historical Statistics of the United States: Earliest Time to the Present. New York: Cambridge University Press.
U.S. Census Bureau. (1975). Historical Statistics of the United States, Colonial Times to 1970. Bicentennial Edition. Retrieved from https://fraser.stlouisfed.org/title/historical-statistics-united- states-237
Xi, J. (2020). Speech at the 28th group study session of the Political Bureau of the 18th CPC Central Committee on November 23, 2015. Qiushi (16).
The above article was originally published in English here on Monthly Review Online.
The main cost of the Iran War will be in human death toll. There is also the question of the national sovereignty of Iran, as the recent destruction of nations such as Syria, Iraq and Libya testifies.
In all cases the costs will be far-reaching and will mount the longer the attacks from the US, Israel and their allies continue, Britain chief among them. The same is true of the global economic and social costs of the war, which we already know will be considerable.
The supply of oil and of liquified natural gas (LNG) has been severely restricted through the Straits of Hormuz. So too has the passage of other essentials such as food and fertilisers. But there has also been structural damage to the supply of energy products, following the attacks on refining and port facilities across the region, both offensive attacks and the retaliatory ones.
The extent of this structural damage cannot be known until the war is ended. But it is possible to identify some of the parameters of the economic consequences that lie ahead.
Economic impact
Before the US launched its war, along with Israel, the price of the Brent crude benchmark was under $70 a barrel. At the time of writing it is $115/bbl and has traded as high as $120/bbl. An array of oil-based products has risen between 40% to 50% from a year ago, while gas prices are currently generally 90% higher than a year ago.
Globally, the net oil importers require approximately 40 million barrels of oil a day (almost a quarter of which normally passes through the Straits of Hormuz). That means their daily cost of oil consumption alone has risen from under $3 billion per day to over $4 billion.
But that is only part of the picture. All consumers of oil products, whether importers or not, are affected by the world price of oil, even if the direct impact is often mediated by taxes, subsidies and long-term supply contracts.
Global oil consumption is a little over 100 million barrels per day, implying that the total world cost of the consumption rises from $7 billion per day to well over $10 billion per day. Coincidentally, recent daily expenditure on gas consumption amounts to almost exactly the same, at around $10 billion, although the increase in costs has been greater, closer to $4.5 billion per day, rather than the $3 billion per day rise on outlays on oil.
As natural gas prices make up about 70% of the cost of fertilisers, the impact on these products has been considerable. Food production is already under pressure worldwide. There are also widespread reports of perishable food products rotting on ships that cannot pass through the Strait. An additional factor arises from reports that the cost of shipping insurance has risen from 0.25% of the vessel’s value to 7.5%.
Indirect consequences
The widespread use of fossil fuel products in both the production and distribution of many other commodities means that changes in price have a very large effect on other sectors of the economy. A severe shortage of supply will limit both production and distribution for many sectors.
The International Monetary Fund (IMF) estimates that every 10% rise in the oil price adds 0.4% to global inflation and reduces world GDP growth by between 0.1% and 0.2%. Even though the US is now an oil exporter, the official assessment from the US central bank is broadly similar in its impact on the US economy.
In Britain, the Bank of England’s rule-of-thumb on the effects of an oil price shock are completely in line with this assessment, although both the Organisation for Economic Co-operation and Development (OECD) and the International Monetary Fund (IMF) suggest that Britain is going to be one of the worst-hit of the OECD member countries among the advanced industrialised nations.
This is because of two effects. One is the very high levels of energy imports in the British economy. The other is the peculiar system of energy pricing in this country, which regulates the price of all wholesale energy at the cost of the most expensive energy, which is usually gas.
It is this way that the market is structured (effectively at a permanent subsidy to gas producers) that makes nonsense of all the claims the reopening depleted North Sea fields will solve the energy crisis here. These fields have been closed because declining stocks mean that the remaining fossil fuels are extremely expensive to tap. An increase in output from this source would significantly increase the price of energy in this country.
But the greatest dislocation to the world economy is certain to be felt in large parts of the Global South. In many countries, short-time working and energy rationing has already been put in place. The level of strategic energy reserves is often very limited or even close to zero. Soaring prices mean that some countries will simply be forced out of the energy market altogether.
In general, the economic effects from the attack on Iran will be very negative, even if the armed conflict ended tomorrow. The longer the conflict lasts, it becomes more likely that economic slump, surging inflation and outright shortages of essentials including food will be the norm.
The world economy is both more industrialised (and energy-dependent) than it was during the 1970s oil price shock and international trade is much bigger part of the world economy. Trade now accounts for about 60% of world GDP, compared to 25% in the 1970s.
The 1970s oil price shock was also preceded by the long boom following the end of World War II. Now, it arises after a prolong period of weak growth and high prices since the Global Financial Crash in 2007-08. As a result, the misery created could be very severe.
Of course, in all crises, the rich and powerful are somewhat insulated from the effects. It is workers and the poor who bear the brunt. As we have recently seen in the Covid crisis and the Ukraine war, energy companies, banks, food retailers and landlords are completely unscrupulous in profiteering even where there own costs are largely unaffected.
Government finances will also come under pressure when they are already weak. There will be a clamour to cut welfare, public spending and public sector pay to offset, although this will not be applied to military spending. It is the rampaging of the US, which seems to have declared war on half the world, which got us into this mess.
The question arises, why does the US believe that this is all a price worth paying? Even at the most self-interested level, the war effect on US gas prices is going to be extremely negative for the Republican party in the US mid-term elections in November.
Trump is operating strategically in the interests of US capital as a whole, and he has backing for his aggression. He is attempting to recoup militarily what has been lost economically, above all to China. The US is no longer the world’s sole economic superpower, but has far greater conventional military firepower than the rest of the world combined. The war in Iran is now the centrepiece of a global effort to reassert US global dominance on all fronts. As a result, this war, or other wars are very likely over the next period.
There could be a response that alleviates some of the worst effects of Trump’s forever wars. Radical measures to control prices, to direct investment and to push for renewable energy will be needed. The alternative is that workers and the poor globally will be left bearing the significant costs of yet another illegal war.
An earlier version of this piece appeared in the Morning Star here .
In Britain, Marxist economics is not very popular, even among Marxists. Instead, an eclectic mix of ideas prevails. Beginning with an objective analysis of the current state of the economy, the framework here is that Marxist analysis cuts through the popular misconceptions on the economy and addresses the sources of the current crisis.
It is now possible to argue that a chronic British crisis is becoming an acute one.
It is widely understood that historically, Britain was the dominant economic power in the world. That period lasted effectively after defeat of Napoleon and from 1820 onwards to 1870, when relative economic slowdown began. For a long time, this trend was obscured by the existence of the British Empire. It seems that in the minds of many, it still is. The cause of the decline was that British capitalism found more profitable outlets for investment internationally, where it could use superior technology and/or brute force to win and dominate new markets. The Empire meant that the potential for profits in the domestic market was always going to struggle to compete with starvation wages in the colonies.
This became the ‘British disease’, the lack of private investment and the inevitable economic relative decline that followed. That is the long history.
But this is also extended through to the current crisis. The chronic relative lack of investment has now become acute. In 6 years since the 1st quarter of gross 2019 private sector investment has risen by just 8.7%. This is barely 1% a year and questionable whether this corresponds to a rise in net fixed capital formation, as it may well be less than the rate of depreciation and dilapidation.
The British economy’s Investment (Gross Fixed Capital Formation, GFCF) is about £500bn a year, equalling about 9% of existing capital stock. Most accountants would not allow a firm to depreciate its capital stock by just 9% a year, it would need to be much higher. Even if ‘UK plc’s’ capital stock does include railways and bridges (which have a much longer useful lifespan than firms’ fixed capital), GFCF which is just 9% of the existing capital stock seems too low to match the replacement level. The functioning capital stock of the British economy may be contracting.
The competition with confusion
Marxism is not necessary to outline this crisis. But it is necessary to explain why this has happened in this way, or to begin to outline an effective response to the crisis.
Firstly, this is because mainstream economics offers only confusion where explanation should be. To give a very concrete example of this, the Bank of England insists that there is a ‘productivity puzzle’ in terms of explaining the low growth of the economy and of productivity in particular. And there are 792 citations for 10 scholarly articles on the productivity puzzle on the first Google page alone. It is a very popular idea.
Yet there is no puzzle at all. If we take manufacturing, ONS data are startling and decisive. In real terms the manufacturing stock of fixed assets is almost unchanged over nearly 30 years. The means of production in the British manufacturing sector are not increasing.
As a result, it is extremely difficult to increase the output of the manufacturing sector. Yet, in fact, manufacturing production has increased at a very moderate pace over that time. In addition, when the total workforce and hours worked have also both declined sharply, the modest rise in output is closer to a productivity miracle than a productivity puzzle.
Of course, mainstream economics has a vested interest in obscuring the causes of the crisis, including at the very top like the Bank of England and the OBR. They represent the interests of the class that is responsible for the dearth of investment and the crisis overall. That is inevitable.
To take another example, there is an army of private sector economists in this country, many of them working in finance. Yet how many of them ever refer to the 2007-2008 crisis being caused by the over-speculation of the finance sector, its deregulation the economy’s over-reliance on finance and the role of US finances in provoking the global slump? Of course they do not. They have a vested interest in obscuring that truth too.
But what about the non-mainstream forces? The people who do not accept mainstream explanations for the crisis? If the British capitalists are on an investment strike, why is the British left on a strike against Marxist economics? Why is the most popular economist on the British left Keynes, who was a Liberal? And, even then, why do they mostly reject his prescription for a “somewhat more comprehensive socialisation of investment”?
They refuse to accept the role of the public sector, the State, interfering in the realm of the private sector, which in a capitalist economy like Britain in peacetime, dominates the investment function. They do not advocate increasing socialisation of investment.
Instead they promote a series of alternative explanations. These merit discussion because unfortunately they dominate the economic thinking of the progressive forces in this country.
These ideas include, but are not exhausted by:
The government can just print money to get out of the crisis
Tax revenues don’t fund government spending
Governments can spend without limit
Boosting Consumption is the way of the crisis, because under-Consumption is the cause
Financialisaton is the cause of the crisis, and ethical banks or bankers are the answer, there are many more.
The fact that most of these nostrums, where possible, have been tried in the very recent past and failed does not impinge on their thinking:
Biden/Trump/Sunak boosted Consumption without Investment and all we got was inflation
All the G7 central banks printed money without limit and we got no substantial economic recovery
Liz Truss spent without limit, and look what happened next
Aside from abolishing taxation, it is hard to test the claim that taxation does not fund government revenues, but we can be sure disaster would strike very quickly. Merely cutting taxation, like Reagan and Thatcher, or Milei now leads to ballooning deficits
And, good luck with finding ethical banks or bankers!
As we know, Keynes was a Liberal, albeit one who, in the realm of finance and the economy was attempting a largely objective analysis of the various economic crises of his lifetime, related to WW1, Versailles, the 1929 Crash and WW2.
However, much of the inner workings of the economy remained a mystery to him, even though those inner workings, and their ‘laws of motion’ had already been analysed by Marx. These include trade, which is how Capital begins, profits and their centrality under capitalism, the law of the tendency of the profit rate to fall, the Marxist law of value, and so on.
Many of these key analyses are either completely misunderstood or neglected altogether, even in left narratives on the economy. You are more likely to hear the word profits on a US business channel that you are in a political discussion about the economy.
But they all need to be reinstated, even if this seems like an uphill task. Because there are material interests and social forces which have every interest in removing Marxism from our lexicon, in denying his analysis and ignoring a whole body of work.
Harold Wilson famously said he had opened Capital at the second page and promptly closed it again. True or not, matters have not improved since.
The explanation for this lies in the role of the labour and trade union bureaucracy. They preach social peace, Marx does not. The prefer ‘keynesian’ solutions, not disruptive Marxist ones that might lead to conflict with capital. They hanker for a return to keynesianism now, when Marxism suggests that is no longer possible. Attacks on welfare, the war drive, repeated bouts of high inflation and the renewed turn to draining the public finances all point in the same direction. Capital is on a major offensive, essentially to increase the rate of exploitation as their way out of the crisis. They have no interest in listening to pleas for pump-priming the economy.
There is an alternative
Marxism tells us that a society develops economically through the accumulation of capital and the development of its productive capacity. In addition, the development of those productive forces outgrow and come into conflict with the existing relations of production, private ownership. But it also tells us that the capitalists’ dream is to accumulate without investment.
Taking these together, in Britain now we have instead the nightmare where the capitalists do not invest, the productive forces are not growing and their only method of accumulation is to increase the rate of exploitation.
A government attempting to operate in the interests of the working class and the oppressed would need to break this logjam. The main way to break it is through a sharp increase in public sector investment.
Of course, there is no reason in principle why at least sections of the ruling class might oppose such a policy. As for the allocators of capital in the bond markets, there are no borrowing restraints either when real long-term interest rates are below 1%, contrary to the claims of even some left economists.
After all, many private sector firms would benefit from public investment in housing, transport, IT and renewable energy. And many more would benefit indirectly from policies that improved conditions and health of workers, that cut delivery times, that improved connectivity or lowered their bills. The public sector has frequently rescued the private sector, most recently in the banking crisis of 2007-08.
But there is both a structural and conjunctural objection to these policies. In extremis, previously violent objections the public sector intervening in the economy can fall away if sectors of the economy have either exhausted their potential for profitable returns (say the train operating companies) and/or their disrepair undermines other sectors of the economy (such as the coal industry at the end of World War II). But these are exceptions, not the rule. Generally, there is ferocious resistance to any efforts by the state to encroach on private sector investment.
There is now also a conjunctural difficulty to a programme of public sector-led investment. The crisis of profitability of the British economy means there is a strong tide in favour of dismantling public sector institutions in favour of the private sector. This takes place through underfunding, outsourcing, overcharging, PFI and outright privatisation. The largest public sector organisation in the country is the NHS, and it is subject to all these impositions. But they are widely applied across the public sector.
The most recent development is to funnel public money to private arms’ manufacturers through an increase in the military budget, providing huge profits but no economic benefit whatsoever. There is too the general drive against wages, principally by the policy of stoking inflation, and reducing the social wage through cuts in welfare and the social safety net. Overall, the policy to increase the rate of exploitation to resolve the crisis.
Therefore, the central demand for public investment remains the appropriate economic response to the crisis, and all other schemes have failed over 15 years. But only the working class and its allies have no interests preventing the adoption of this policy. Politically, advocates of the policy should expect to be ignored and dismissed and then viciously attacked only when these ideas become more popular.
Overcoming the failed policies which have lasted centuries is sure to be a prolonged struggle.
The above are some notes made for a meeting at the Marx Memorial Library, ‘What can Marxism tell us about the crisis of UK plc?’ Video of all the presentations can be found here.
Austerity and war, leavened with racism and authoritarianism is what is now being served up to the bulk of the population in the NATO countries. The Alternative Defence Review (ADR) published by CND has a very different perspective to Britain’s recent Strategic Defence Review (SDR), could hardly be more timely or more pertinent.
A mass of evidence is assembled in the report to make a series of arguments that counter the assumptions and findings of the SDR. Here, the focus will be on the key economic arguments for opposing the war drive.
There is no surprise that the war drive is linked to a renewed austerity drive. It is now even drawing in the US, which had previously declined to follow the failed European austerity model. But then Biden let inflation rip to hammer living standards, especially wages, and Trump is completing that one-two on workers and the poor by more traditional methods. In his ‘great big, beautiful bill’ he will raise military spending and cut taxes for the very wealthiest, funded by a combination of borrowing and cuts. Social welfare programmes, especially Medicaid will be cut by $880 billion, which low-paid and poor Americans rely on for any access to health care at all.
Trump makes the link between his military bonanza and the cuts to social protection explicit. There is also an effort in Britain by campaigners to link the two, through slogans such as ‘welfare not warfare.’
In fact, the linkage between the two areas of government spending is a logical economic imperative. Grasping that logic will only strengthen the anti-war movements in this country and internationally.
There are only two broad categories for production; Consumption or Investment. Of the two, only Investment can augment the means of production, and so create the conditions for an increase in production which is the basis for prosperity – that increased production can then only be directed either towards consumption or towards Investment. Therefore, while the sustainable satisfaction of human needs (consumption) is or ought to be the purpose of economic policy, the necessary means to achieve that is Investment.
The definition of Investment is that it will add to or replace the existing means of production. Anything which adds to level of fixed assets in the economy is properly categorised as Investment (Adam Smith’s term for the level of fixed assets in the economy was simply ‘stock’).
Despite the best efforts of Keir Starmer and others, spending on the military is not Investment, not even military hardware. This is because missiles, bombs and fighter jets are not additions to the means of production. They can only destroy the means of production, as well as people. Military hardware is the opposite of Investment. They are the means of destruction.
As it is not an input into production military spending can only be categorised as consumption. But other items that are categorised as consumption are not only extremely useful but vital to the well-being of the population. These includes spending on health, or education, or social welfare. Not all consumption is equal. Some of it is vitally necessary to human society, other consumption spending is simply destructive of it.
In this country and in many other NATO members there is a great deal of talk about public Investment. But the reality is very different. So, the recent announcement from Rachel Reeves following on from the Treasury’s Spending Review is that there will be £725bn in public Investment over the next 10 years. But this is less per year than the £77.6bn of public Investment in 2024. Public Investment is being cut.
But once the (smaller) envelope for public Investment has been set, that determines the level of funding available for consumption. In the domestic economy as a whole Investment + consumption must equal 100% of the economy. So, public Investment + public consumption must account for 100% of public spending.
The inescapable logic is that this government must choose between types of consumption within the total funds allocated to consumption. The Starmer government has chosen. It chose to cut international aid and to cut welfare in order to increase military spending. Essentially, under the current total allocated to public consumption, the government chose between welfare funding or military funding. It made the wrong choice.
Anti-war campaigners and anti-austerity campaigners objectively have unified interests. There are no additional funds currently available for military spending except by imposing austerity. This also means there is no logic in supporting increased military funding while opposing austerity. The first is not possible without the second.
The Alternative Defence Review has done a great service in raising these issues. The economic argument reinforces the overall campaign against austerity and war, in favour of prosperity and peace.
The government is in denial about its own austerity policy. It repeatedly claims that it is not reproducing the failed austerity policies of the Tory years. Ahead of the Spending Review this week, it is important to set the record straight – to show that the government’s policy is austerity and attempts to do that are misleading and counter-productive.
The latest effort is by Torsten Bell MP, who holds two junior ministerial posts at the Treasury and the Department for Work and Pensions. He previously worked as director of policy for Ed Miliband when he was leader of the Labour party and, more recently as a principal of the Resolution Foundation. He is widely considered to be one of the more astute economic brains in the Starmer government. So, his intervention in the government campaign of denial about austerity is worth consideration.
That intervention came in the form of a chart on his ‘X’ account, reproduced below, as well as a longer explanatory video which is also available there.
The chart shows Total Departmental Spending (TDEL) from 2009/10 to projections under the Labour government until 2029/30. On the face of it the red line of Labour planned spending clearly shows a rising trend, which seems to strongly supports the claim that austerity is over.
However, a closer examination of the chart does not support Bell’s contention. The dark black line starts to rise in in 2016/17. On this basis, “we” did not end austerity. The Tories did 9 years ago. All of us who have been complaining about austerity are fools! Austerity ended years ago, according to Bell’s chart.
Yet public services have deteriorated, NHS waiting lists lengthened and living standards have deteriorated over that time. Austerity has been very much in place over the entire period.
The reason austerity did not end in 2016/17 despite real terms increases in government spending is because those increases were not sufficient to cope with the pressure of a rising and ageing population, or to reverse the damaging effects of previous austerity.
Under current plans, the Labour government will continue that trend. Spending will increase, but insufficiently to end austerity. The table below is taken from the March 2025 Economic and Fiscal Outlook from the Office for Budget Responsibility.
Table 1. Total Departmental Expenditure Limits
The table shows that the government plans for TDEL (Total Departmental Expenditure), highlighted, are extremely weak, beginning with a cut over 1.6% in the last year of the Sunak government by ending with just 0.6% and 0.7% growth in the last 2 years of this parliament. Over the entire period, growth in Departmental spending will be little over 1% on average per year.
Of course, it is possible that the Spending Review will show a complete change of heart by the government, a recognition that austerity does not have the claimed effects and that large-scale public investment is necessary to lead economic recovery. But the signs do not look encouraging.
The whole world is caught up in the negative effects of Trump’s tariffs. But the US Administration’s principal target is clearly China, which has been singled out for extortionate levels of trade tariffs, combined with threats to third countries who continue to trade with China.
At the same time the rest of the world has been subject to far lower, but highly damaging tariffs, with the threat of further actions to come. A further consequence is the impact on the US itself, with the prospect of much lower growth, higher prices and job losses now widely anticipated. This in turn has caused turmoil in US financial markets and has led to the unusual situation where all main US assets, the stock market, government bonds and the US Dollar have all fallen at the same time.
The main questions posed are:
Why has Trump conducted policy in such a reckless manner?
What will be the effects of the tariffs?
What are the long-term consequences?
Falling behind China
The context of the US economy’s weight in the world in framing Trump’s policies. The US economy has been growing at a considerably slower pace than China since at least the late 1970s and the beginning of the Chinese ‘reform and opening up’ period. For much of that time, this was of little consequence to the US.
But in terms of economic size (using Purchasing Power Parities, PPSs, to measure real output and ignoring the effects of currency differentials), the World Bank calculates that the Chinese economy surpassed the US economy in 2016, as shown below.
Chart 1. Chinese and US economies’ real GDP (PPPs)
Source: World Bank
The World Bank now estimates that the output of the Chinese economy was $34.66 trillion in 2023, versus $27.72 trillion for the US. This makes the Chinese economy effectively 25% bigger.
But the growth trends in the two economies are making this disparity an urgent matter for the US. This is because the growth gap continues to widen rapidly.
This is illustrated in the recently published IMF World Economic Outlook (WEO) database (April 2025). On their projections, by the end 2030 the US economy will be $37.15 trillion (PPP terms), while the Chinese economy will be $54.23 trillion. This means that by 2030 the Chinese economy will be 46% bigger than the US. For comparison, just six months ago in the October 2024 WEO, the IMF projected that by end-2029 the Chinese economy would be 38% larger than the US economy.
Over a slightly longer time frame, it is easier to see why there is a sense of urgency, even reckless urgency, from the Trump Administration. The US economy has doubled in size in last 17 years, according to World Bank data, while Chinese the economy doubled in size in 9 years. If both economies maintained that trend from their current starting points, the Chinese economy will be double the size of the US economy in little more than a decade. It would be four times the size of the US economy in 20 to 25 years’ time.
So in a very few years, on current trends, the Chinese economy will be out of sight compared to the US economy. The US will have decisively lost its position of global economic dominance and all that goes with it.
As this would be a world-historic defeat for the US, it is not something that its ruling circles are willing to accept at all. The ultra-aggressive stance on tariffs reflects both the scale of what is at stake and the urgency of their response.
Tariffs and how they operate
It has been widely shown that the supposed logic for the scale of the tariffs for each country is completely spurious. This is further underlined by the repeated changes to the tariff levels and, the date of their implementation and the the exemptions in certain sectors (and the U-turns).
This is because the tariffs themselves, while having a serious negative global economic effect are essentially politically determined.
At one end of the scale is a country like Britain, which regards itself as a close ally of the US, which has been hit with general tariffs of 10%, with 25% on cars and possibly more to come on pharmaceuticals. As noted previously, China is regarded in the US as its principal rival, if not enemy, and has been hit with 145% tariffs. This is effectively an attempt to end US-China trade. It is reinforced by the US threat of further sanctions on theird countries which continue to trade with China.
The negative effects for the global economy are widely acknowledged, if somewhat understated in terms of the impact on the economies of the Global South. In the April 2025 WEO, for example, the IMF slashed growth forecasts as a result of the tariffs, while simultaneously raising inflation forecasts for the advanced industrialised countries.
By contrast, UNCTAD, the UN trade agency is much more pessimistic. UNCTAD forecasts that global growth will slow to just 2.3% this year, which below its marker for world recession of 2.5%. UNCTAD says “developing countries and especially the most vulnerable economies” will be hardest. This is because, as UNCTAD argues, many low-income economies now face a “perfect storm” of tariffs and lower trade, existing unsustainable debt levels and slowing domestic growth.
It should also be remembered that an immediate casualty of the tariffs is the US economy itself. Although Trump continues to insist that the US is financially benefitting from tariff revenues, this cannot be true. This is because tariffs are never paid by the exporters, but by the businesses and individuals who are importing the goods. This means US businesses and consumers are paying Trump’s tariffs, which will reduce incomes in the US itself. It is in effect a Federal tax on the imports of US economy, whether for investment or consumption purposes.
Trump’s other key claim in favour of traiffs is that they will lead to ‘re-shoring’ of jobs. This is based on the false assumption that the jobs naturally belong in the US, and by punishing other countries and damaging their ability to export to the US, production will relocate to the US. Again, this includes all countries in its scope, but is particularly aimed at China.
The entire framework for this policy is shot through with contradictions and false assumptions. To highlight just some of the more important ones:
The US economy now accounts for something over one quarter of world GDP and a little over one-eighth of world imports. Unless any country is almost wholly dependent on US imports (and for most of the world China is now a bigger trade partner) then higher import tariffs to the US will tend to force diversification to other markets (including into domestic markets) rather than economic collapse. Even for countries such as Mexico and Canada, the tariffs are so damaging and other demands from Trump so stringent they too are probably forced to diversify away from the US.
Advanced manufacturing is increasingly complex, capital-intensive and relies on global supply chains. Price (and raised prices via tariffs, or the cost of labour) are just one element in the question of the location of production. Access to high skills, openness to the required supply chains, access to raw materials and reliable energy sources, highly developed infrastructure and a large, growing domestic market are all key factors. In many instances, the US simply does not offer these prerequisites.
The same issues apply to re-location as to location. The world is not obliged by costs to relocate to the US. In fact, in light of the tariffs to be paid by relocating to the US, there is an incentive to seek alternatives.
Tariffs have been tried in the recent past, with little success. There was a roughly 10% increase in US manufacturing jobs in the years following both the tariffs of Trump’s first term and coming out of the pandemic. But neither of these were ‘re-shoring’ as world manufacturing jobs increased at a greater rate over the same period.
In effect, Trump’s policy is to lay siege to the whole world in order to isolate China. However, given the US weight in the world economy and global trade, as well as the enormous complexity of global supply chains, with China often at their hub Trump, he risks the main effect is to isolate the US economy.
Trump’s gambit
In any contest where one side is decisively losing, a high-risk strategy may become appealing for them. The increased risk contains its own pitfalls, but opens the possibility of eventual victory, which is more attractive than inevitable defeat.
Trump’s tariff policy is incoherent and unworkable, for reasons noted above. Fundamentally, they cut across a decisive factor of economic development. The necessary condition for optimal economic development is the fullest possible participation in the international division of labour (or more accurately, the socialisation of production).
For fledgling industries or even economies, protectionist tariffs can be a useful tool for economic development, with the intention to lower those tariffs when there has been sufficient development and participation can actually take place. But for advanced industrialised countries like the US, tariffs entail cutting off the economy from participation in the international division of labour.
The same applies too to protectionism in other advanced industrialised countries in the G7. Protectionism, subsidies without sufficient investment and ‘buy domestic’ campaigns just lead to a cycle of higher prices, low investment and decline. The EU was born as the European Coal and Steel Community behind tariff walls (with Britain treading the same path, sometimes independently) but now there is very little steel, coal, shipbuilding or other industries which are thriving in the rest of the world. Cars may be next.
But Trump’s tariffs are not designed to succeed by economic means. They are a device to politically re-engineer the world in the US’s favour.
As previously noted, China is the principal target for the US, as the singularly extortionate tariff levels show, the absence of a 90-day pause and the threat to third countries continuing to trade with China. The much softer but damaging tariff threat to third countries is designed to enlist those countries on the US side in the trade war with China. Even then, there will be a price to pay as Trump seeks to enrich the US at their expense. This aligns with his military policy, also increasingly directed at China, with strong pressures on other NATO countries (and others) to ramp up their funding of the US war efforts.
The tactic is to force other countries to choose the US over China as a trading partner, cemented by the US’s long-standing military dominance over all other countries. Clearly, China’s rejection of Trump’s various demands and ultimatums means it has no intention of acceding in its own demise.
But there are a number of other economies which have sufficient weight in the world economy and provide crucial links in global supply chains, which mean they have both the capacity and incentive to resist Trump’s enforced choice. Principally, these are the EU, India and Japan.
It is unclear ultimately how they will respond, but surprisingly militant and public pronouncements from Japan suggest that Trump will not get things all his own way. Many other countries simply cannot choose the US over China because of existing trade relationships, or have very little incentive to, given China’s active role in their economic development. This is especially true in poorer parts of Asia, much of Africa and some countries in Latin America.
By contrast, the incoming German Chancellor Merz is reported to have offered Trump a zero-zero tariff regime on trade. Others who have offered the same have been rebuffed by the US. But zero tariffs (and presumably alignment on food standards) would devastate European agriculture and cause huge social unrest.
The Trump offensive is also not confined to overseas opponents or enemies. It is also a two-pronged attack on American workers and the poor. In this way, Trump aims to increase the profits of major corporations and their share of national income.
The first prong is a direct attack on social spending with $2 trillion in planned government spending cuts. The largest slice of this is a planned $880 billion cut to Medicaid and other federal healthcare programs. But the second prong is inflation. Since the financial crisis of 2008 it has proved very hard for Western governments to cut nominal wages via austerity. It has been much easier to cut real wages by stoking up inflation, which began in the US in early 2020. Not only will the effect of tariffs be to increase US (and other) rates of inflation, that process will be reinforced by a simultaneous $1 trillion tax cut which will overwhelmingly benefit the ultra-rich.
Inflationary tax cuts for US oligarchs and social spending cuts for workers and the poor are a blatant class war approach to fiscal policy. It remains to be seen what resistance these policies meet from those most badly affected.
Finally, there is the Achilles’ Heel of Trump’s policies in the form of US financial markets. Typically, stock markets rise with improving sentiment on the economy, while bonds rise as economic optimism fades. The global dominance of the US Dollar should mean that either one ought to be the international ‘safe haven’ in a time of political and/or economic turmoil. But in response to Trump’s policies both main US financial markets have fallen simultaneously, along with the US Dollar itself. This directly impacts the market wealth of millions of Americans, and particularly the set of oligarchs that Trump represents. Any softening of the tariff policy is greeted with huge relief in these financial markets; every new threat from Trump provokes a renewed sell-off.
Conclusion
This combination of linked factors; China’s refusal to be subordinated, other countries’ reluctance, the conflict with American workers and the fragility of US financial markets all mean that Trump has lost the first battle in this war, as even arch neo-liberal outlets like the Wall Street Journal acknowledge. ‘China called Trump’s bluff and seems to have won this round’, was its verdict.
But following from the analysis above, and the incredibly high stakes for the US, we can be certain that there will be many more rounds to come. The whole world will be affected for many years to come.
The contrast between the way the crises in steel production at Scunthorpe and Port Talbot has been stark. Both plants owned by companies based overseas. Both seeking a way out of unprofitable production. Both in negotiation for subsidy from successive governments for outcomes that would lead to massive job losses. Both looking to close aging blast furnaces earlier than originally planned because they have been making significant losses.
In the case of Port Talbot, this led to a deal to convert to Electric Arc Furnaces to secure sustainable steel production at the site, but with the loss of 2,500 jobs and only 300 retained. This was dependent on a subsidy from the government of £500 million. A similar deal was not clinched at Scunthorpe, as the crisis was brought forward by Trump’s imposition of a 25% tariff on UK manufactured steel – which led to an announcement of imminent closure from the company the following morning. A closure would mean 2,700 jobs lost – on the same scale as Port Talbot.
In Port Talbot, in the absence of a serious just transition process involving the unions, which were excluded from the discussions by the company and the then Tory government, the job losses are being dealt with by the same sort of offers of retraining as have been proposed for the Grangemouth oil refinery in Scotland. In the case of Scunthorpe, also with no just transition process, the government has rightly stepped in to take charge of the plant to keep the blast furnaces running in the short term; which means that the losses previously borne by the company will now be borne by the Exchequer. With the company losing £255 million a year, the governments £2.5 billion steel transformation fund can absorb this in the short term. Workers at Port Talbot have expressed some bitterness that this was not considered for them.
What has been different is the mobilisation of Sinophobia around British Steel’s ownership by a Chinese company, Jingye. Indian based Tata Steel’s ownership of Port Talbot was certainly mentioned in news coverage, but not on the blanket, verging on obsessive scale that British Steel’s Chinese ownership has. Tata’s brinkmanship in negotiations was also mentioned, but they were not accused of “negotiating in bad faith” in the way that Jingye have. Both companies have behaved as you’d expect a capitalist company to behave, though if you read Jingye’s Group Introduction you can see how their operations inside China are turned to more positive social objectives – from a high wages policy to greening their workplaces – from being based in a country run by a Communist Party, not by their own class. But here, both Tata and Jingye are in it for the money. Their UK operations have only been viable as a tiny loss making fragment of a much larger business, as part of an attempt to implant themselves in a variety of global markets in the hope of profitability in the medium to long term. Steel production at Port Talbot in 2022, for example, was just 10% of Tata’s global production of 35 million tonnes.
After Port Talbot, there have been no denunciation of Indian investment into the UK, nor any calls in the media or Parliament for any “urgent review” into India’s role in the UK, or paranoid accusations made explicitly by Farage but echoed by “senior Labour figures” as well as Tories in the media but not in the recent Saturday debate in Parliament, that the attempted closure in Scunthorpe is part of a dastardly plot by the Chinese government to sabotage a strategic British industry, not a commercial decision in which a company is seeking to cut its losses in all the ways British capitalist company law allows them to; including cancelling orders for the raw materials they’d need to keep running the blast furnaces they want to close. Instead, there has been serious negotiations with the Indian government to set up a trade deal, which was reported last week as “90% done”.
No decoupling there.
The attack on commercial engagement with China fulfills two objectives. One is a straightforward attempt to mobilise popular sentiment in defence of steel workers jobs behind a Cold War sentiment in a wider context in which the Trump administrations policies have shaken up popular faith in deference to the US. An anti Chinese attack distracts from that and pushes people back towards habitual hostilities.
The other opens another front in the resistance to any serious action on climate change that could threaten the profits of the fossil fuel sector. Accusations from the Right have been:
The blast furnaces could have been kept running with locally sourced coking coal from the cancelled Whitehaven mine. This misses the point that the coke from this mine – had it been developed – would have had such a heavy sulphur content that it was too poor quality to be used at Scunthorpe, so this is a consciously mendacious and fundamentally unserious talking point.
High energy prices in the UK are because of “Net Zero”. This, as they know, is the opposite of the truth. The UK has high energy costs because they are tied to the price of gas far more than any other country in the G7. See Figure 1. We should also note that the oft repeated “solution” to this problem from Reform or the Tories is massive investment in nuclear power instead. The problem with this is that the cost per Kilowatt hour of energy generated by nuclear power is higher than gas, which is higher than renewables. See figure 2. So their way forward would actually compound the problem. Paradoxically, their attack on Chinese investment in UK nuclear power development, and the withdrawal of Chinese investment from Sizewell C in Suffolk and Bradwell in Essex, is making the financing of these projects almost impossible. So, in this case, the contradictions of their politics means they will neither have their cake, nor eat it.
Figure 1
Figure 2
These themes came together in a front page broadside from the Times on 15th April directed at Ed Miliband’s recent trip to China aiming to improve relations and develop better sharing of expertise on the climate transition. Miliband’s is the head that the right wing press is keenest to have on its trophy wall of sacked ministers, hence quite limited and inadequate targets being described as “swivel eyed” and “eye watering” in a constant hammering of lead articles from the Sun to the Telegraph and all the low points in between. Attacks on solar panel installations are increasingly taking the form of accusations of “forced labour” in China, which are untrue, but because it is almost universally believed at Westminster, this threatens a reactionary result on the basis of an apparently progressive concern – as China is the source of 80% of the world’s solar panel supply. However, even if the UK sabotages its green transition by impeding imports of Chinese solar panels this will have little effect globally, as China is increasingly exporting them to the Global South. See Figure 3 Miliband is nevertheless the most popular government minister among Labour members in Labour List’s survey – in which he has a positive rating of 68, compared to Keir Starmer’s 13 – because he is seen as getting on with something positive and progressive, while Liz Kendall and Rachel Reeves are in negative territory.
Figure 3
The call from Dame Helena Kennedy for “an urgent security review of all those Chinese companies operating within our infrastructure which could pose a threat to our national interests – and maybe not just confined to China” threatens to compound the damage already done by the UKs removal of Huewei’s investment in the 5G network, ensuring that the version the country has is slower and more expensive, and the financial difficulty set for Nuclear power station projects by the removal of Chinese investment on the basis of “national security” paranoia. Applied more widely, this neatly lines the UK up with Trump’s trade war against China and sets the UK up for a potential trade deal in which US capital is looking hungrily at the NHS, wants to sell chlorinated chicken and other additive saturated and nutrition less food from their agricultural industrial complex and open up a tax and regulation free for all for their abusive big tech companies, while their President is actively sabotaging global progress towards sustainability by doubling down on fossil fuels. China is doing none of these things. A more positive approach is that being taken by the PSOE government in Spain, which is both encouraging inward Chinese investment – like the joint venture between CATL and Stellantis to build a battery factory in northern Spain and deals signed last year between Spain and Chinese companies Envision and Hygreen Energy to build green hydrogen infrastructure in the country.
Farage, and others on the Right are arguing for nationalisation as a temporary measure just in order for the company to be “sold on” – treating nationalisation as an emergency life support process for private capital -is that there is not exactly a huge queue of companies waiting to buy, and any that did would most likely to be looking at asset stripping. Jingye was the only company interested in 2019, when previous owner Graybull capital gave up on it.
This would also be the government’s preferred approach, because they are nervous of the capital costs involved in making the plant viable. There are three intertwined problems with this.
Attracting a viable private company prepared to put serious money into reviving the plant means attracting overseas capital. Given that more than 50% of global steel production is made by Chinese companies (see figure 4 below) Jonathan Reynolds has changed his tune since the weekend debate in Parliament. That Saturday he was decrying allowing Jingwe into UK steel manufacturing as a national security issue, but by mid-week, a few days later, he was prepared to be more pragmatic about it.
Making the plant viable cannot mean investing in new blast furnaces. These would become stranded assets before they had reached the end of their design life. Despite the determined rearguard action from Trump and others, trying to carry on as though the world isn’t changing makes no business sense. In 2024, for example, all new steel plants developed in China were Electric Arc Furnaces, designed to use scrap steel as raw material. As yet, production of virgin steel has been dependent on coking coal, but the first production using (green) hydrogen and electricity looks like coming on stream in Sweden by next year; so if virgin steel production is considered an imperative for the Scunthorpe site, that model will have to be looked at and emulated as a matter of urgency.
New investment in different production on the site – like almost all capital investment – replaces labour with capital. As with Port Talbot, far fewer workers would be needed for EAFs. Reynolds has talked about “a different employment footprint” for the plant; which is one way to put it. So, the issue of how the transition can be made in a way that opens up alternative employment with decent terms and conditions has to be negotiated with the workers themselves through their unions.
What’s needed is a clear industrial plan that consolidates the nationalisation as a precedent for other sectors and builds on the Scunthorpe plant’s strengths in producing, for example, 90% of railway tracks used in the UK, as part of a strategic plan for green transition. This has hitherto been focussed on a transition to Electric Arc Furnaces, but linking the production of green hydrogen to new generation furnaces capable of producing the tougher virgin steel needed for a full range of industrial applications should also be part of the process; because blast furnaces can’t be kept open indefinitely if we are to stop the climate running away out of a safe zone capable of sustaining human civilisation by mid century.
Appendix
UK steel production is the 35th largest in the world, comparable to Sweden, Slovakia, Argentina and the UAE. Its 4 million tonnes in 2024 is just over a tenth of the production of Germany, a twentieth of the United States, a thirty seventh that of India and a 250th that of China. See Figure 4.
Figure 4
The niche, almost token, position of UK based steel manufacturing reflects a wider process in which UK based capital is no longer primarily engaged with manufacture.
The last time the steel industry in the UK was nationalised in 1967 it had 268,500 workers from more than 14 previous UK based privately owned companies with 200 wholly or partly-owned subsidiaries. These companies were considered increasingly unviable because they had failed to invest and modernise, so were increasingly uncompetitive. This is part of a wider story about how the UK capitalist class has transformed itself since the 1960s. While the quantity of manufactured goods has increased since then, the proportion of manufacturing in the economy has shrunk from 30.1% in 1970 to 8.6% in 2024. The service sector has grown from 56% to more than 80%. UK based capital primarily makes money from selling services, mostly financial, to manufacturing capitalists at home and abroad. They are spectacularly bad at large scale manufacturing start ups, as the debacle of British Volt (whose approach of setting themselves up a luxurious executive office suite before they’d secured funding to even build their factory might be described as cashing in on your chickens before you’ve sold any).
What that means is that most of “British Industry” is owned by firms based overseas, so might be better described as “manufacturing that happens to take place in Britain”. Consider the automotive sector. While there are locally based SMEs in the supply chain, all the big manufacturers depend on overseas investment. Nissan, Stellantis, BMW, VW, Geely, Tata (again). As with locally based steel production, firms like Morris, Austin, even Rover, are long gone for the same reasons as BSA – once the world’s biggest motorcycle company – now only builds retro classic designs as a niche luxury product and Guest Keen and Nettlefold had to be nationalised to save its assets.
Welfare cuts. Reductions in departmental spending. Job cuts in the public sector. But a boost to spending on the military.
These were the main elements of the Spring Statement delivered by the Chancellor.
Yet government ministers seem dismayed that they are accused of implementing austerity, pointing to rising spending in real terms. In reality, as the Joseph Rowntree Foundation shows, the average family will be £750 a year worse off by 2029, and 400,000 households will be pushed into poverty.
Under the Tories, austerity was characterised by cuts for ordinary people and the services they use, while providing tax cuts and tax breaks for big business and the rich. This time is different. Both the October 2024 Budget and the latest Spring Statement imposed cuts for ordinary people, while the statement also provided a bonanza for arms manufacturers. It is still austerity.
It is necessary to unpick some of the government’s policies to show the real changes being imposed, which stand in contrast to ministerial claims. The most important claims centre on the projected rise in day-to-day or current spending, and claims on the growth of public investment.
In the Spring Budget 2024 introduced by Sunak and Hunt, a string of austerity measures was announced, but only to be implemented after the election for obvious electoral reasons. Labour under Starmer signed up to those Tory cuts as part of its own election campaign. It began to implement them in October. The Spring Statement continues and deepens that process.
That explains why we have seen cuts to welfare for the most vulnerable, cuts to international aid, cuts to the winter fuel allowance, and many more austerity measures. The largest of which, by far, was the decision to implement Hunt’s freeze on income tax bands rather than raise them in line with inflation. This will take tens of billions of pounds out of the pockets of ordinary people over time, who will find chunks of any pay rises eaten up by the Inland Revenue.
By contrast, government ministers claim that there is no austerity because total spending is rising in real terms.
But there are a series of problems with this line of argument. The first is that two elements of government spending that are included by the austerity-deniers have no benefit at all in terms of public services. The first is defence spending, which is rising to 2.5 per cent of GDP.
The second, and even larger item, is the rise in debt interest payments. This was referenced in her Spring Statement by Rachel Reeves. In 2021, the cost of servicing government debt amounted to just 1.2 per cent of GDP but soared to 4.4 per cent of GDP two years later and remains at elevated levels. Both of these items are included in the total for government spending, which ministers and others claim “proves” this is not austerity.
Even when these two items are included, government spending is falling as a proportion of GDP. We know that the economy has effectively been stagnant over a prolonged period. The fact that government spending is not even increasing in line with the snail’s pace of GDP is evidence of how hard the handbrake has been applied to government spending.
There is a further factor that should be taken into account. As the population grows, the requirement for public services grows. This is especially true in areas such as health, where the population is not simply growing but ageing too.
As societies become richer, there is a natural tendency to spend more on areas which are fundamental to people’s wellbeing. Health and education are the most important contributions to wellbeing once the requirements for food, shelter, and clothing have been met.
Ministers who insist their cuts are not austerity are ignoring all of these factors. They are also ignoring the reality of the effect of their own policies. Destitution — the lack of these basics — is already on the rise and will accelerate because of these policies.
Scrutiny is needed for claims about the other key area of government expenditure: government investment. There is now a planned increase in capital expenditure, at least over the next two years. But as the Office for Budget Responsibility (OBR) points out, most of this planned increase in public investment is a by-product of the decision to slash the international aid budget to fund the military budget, which is a much more capital-intensive department.
Even with this artificial uplift, the government plans that its own capital investment will go back down in 2029 to the same levels as in 2026. This is not a long-term plan for growth. It is a short-term plan to boost the arms manufacturers, without any significant beneficial effect.
In the run-up to the Spring Statement, there was a lot of propaganda claiming that military spending would provide a significant boost to the economy and to jobs. Both of these claims are false, and the OBR does not include any wider benefit from it.
Capital investment either replaces or adds to the productive capacity of the economy. It enlarges what we used to call the means of production. So, investing in a factory, a machine tool, or a railway allows new production or faster or more efficient production. The opposite is the case for expenditure on a missile, or a tank, or an assault rifle. This can only be used, if at all, to destroy people or the means of production.
The supplementary argument is that investment in arms manufacturers is “jobs-rich.” Rachel Reeves promises to spread those economic benefits geographically across the country. But it is a false promise. As the OBR says, the military sector is capital-intensive, not labour-intensive.
In fact, detailed economic analysis shows that investment in the defence sector is one of the lowest generators of jobs of all. For example, the health sector generates 2½ times the number of jobs for the same level of investment as the defence sector, while also providing a major public benefit. The result of large increases in military spending is overwhelmingly the production of useless or destructive weaponry.
Behind the spin, the inclusion of debt interest payments as “spending,” and the false claims on the benefits of military spending, it is clear that the Spring Statement is deepening austerity. The poor will be made poorer, vital support will be removed, and the average household will be worse off. There is a drive to rearm, being paid for by disabled people, the poor, and the young. It will leave no-one except arms manufacturers better off.
The above article was originally published here by the Morning Star

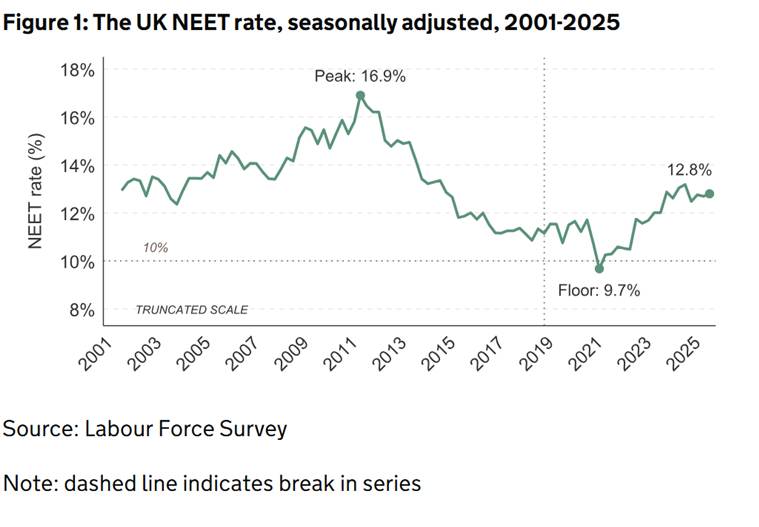
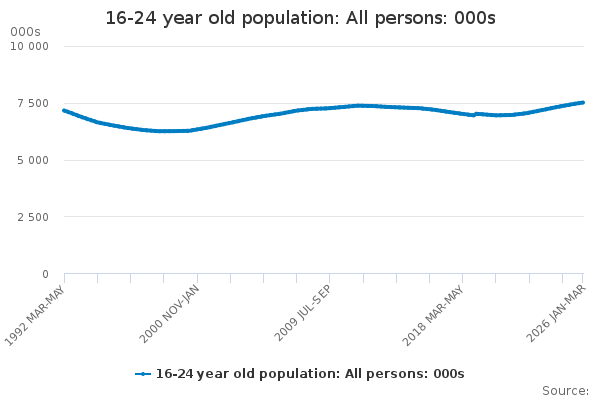
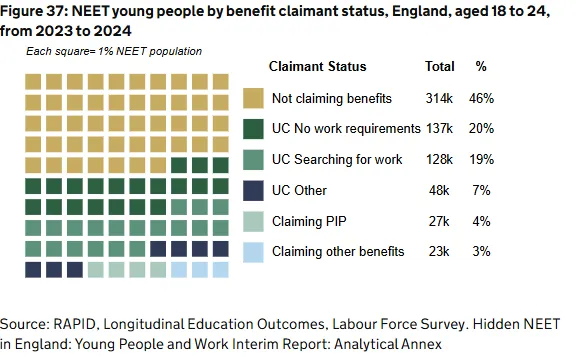
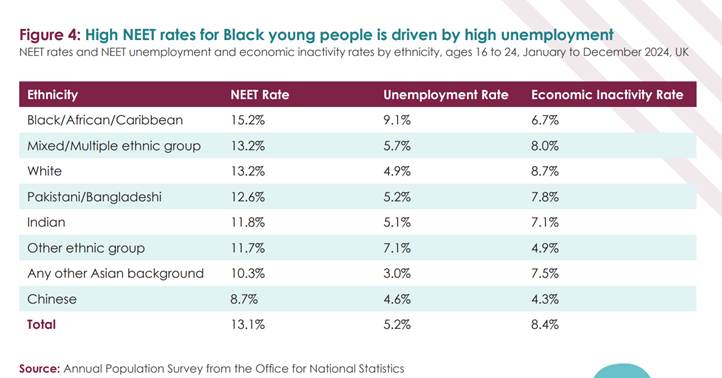
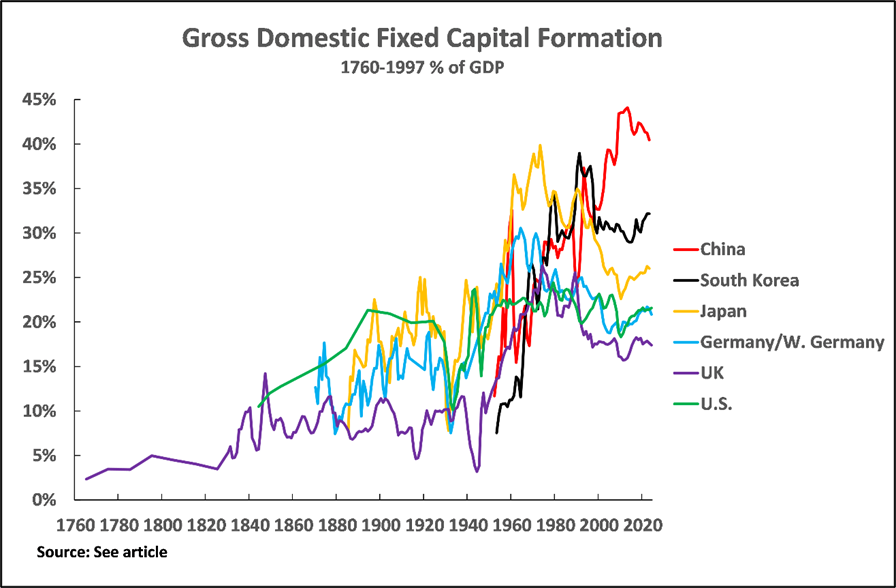
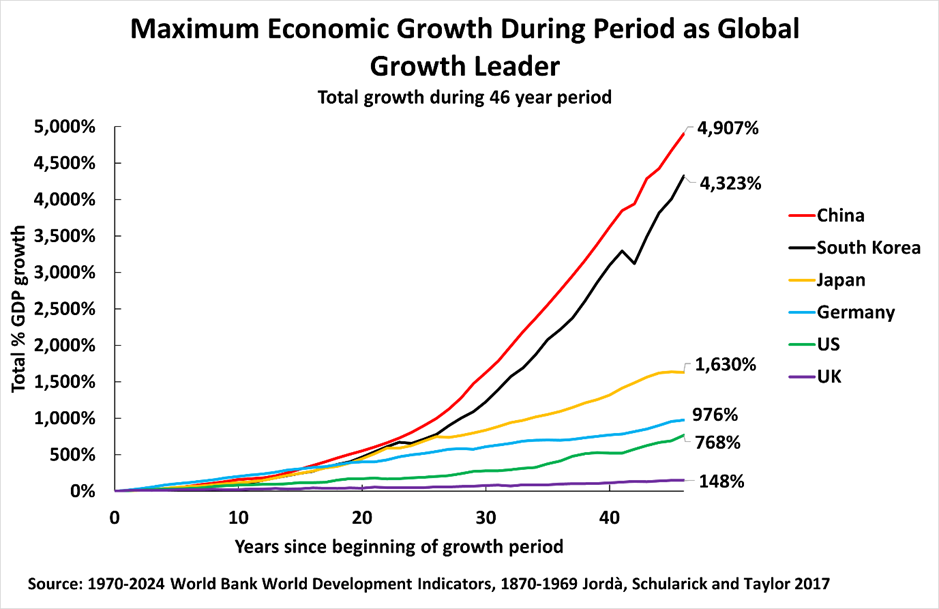

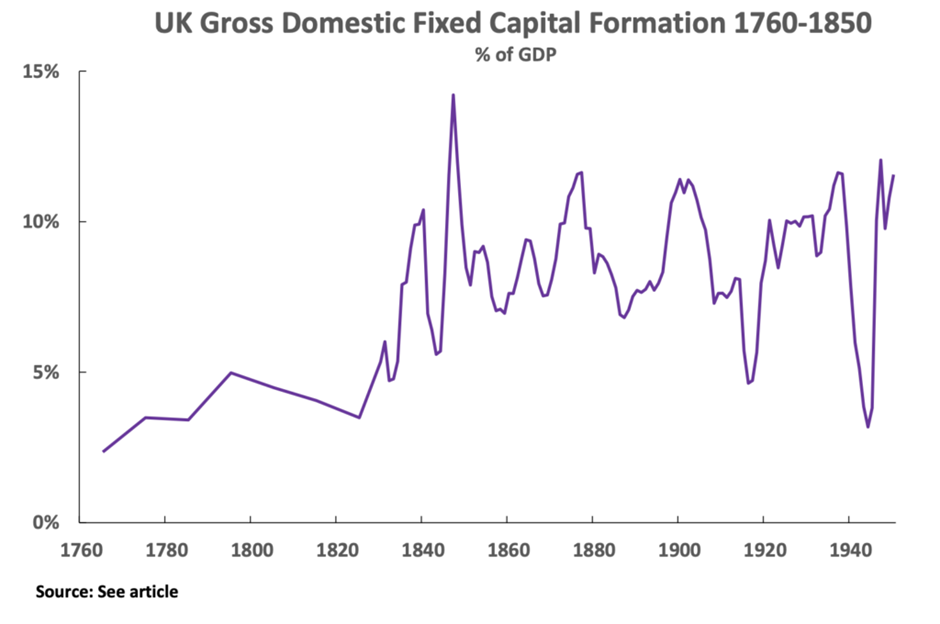
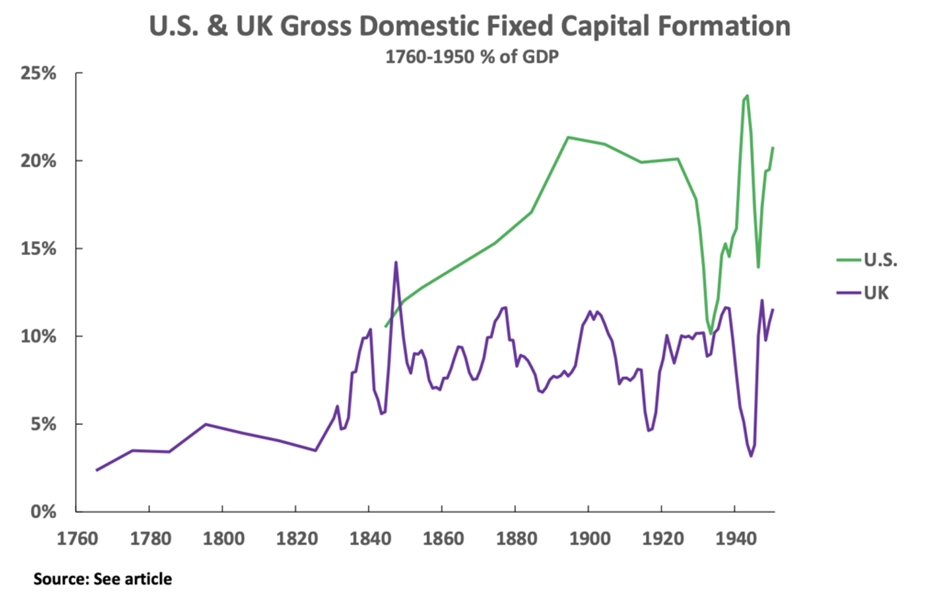
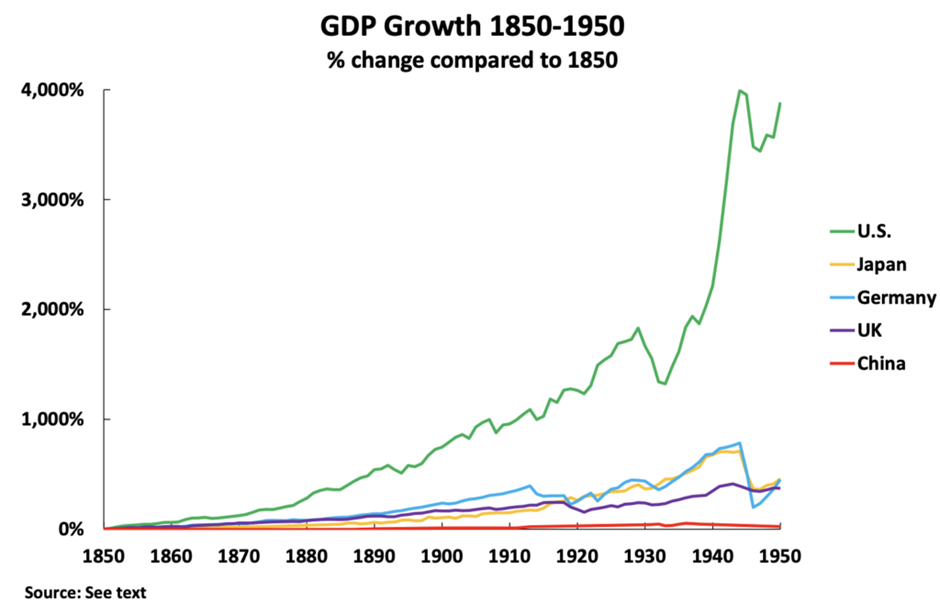
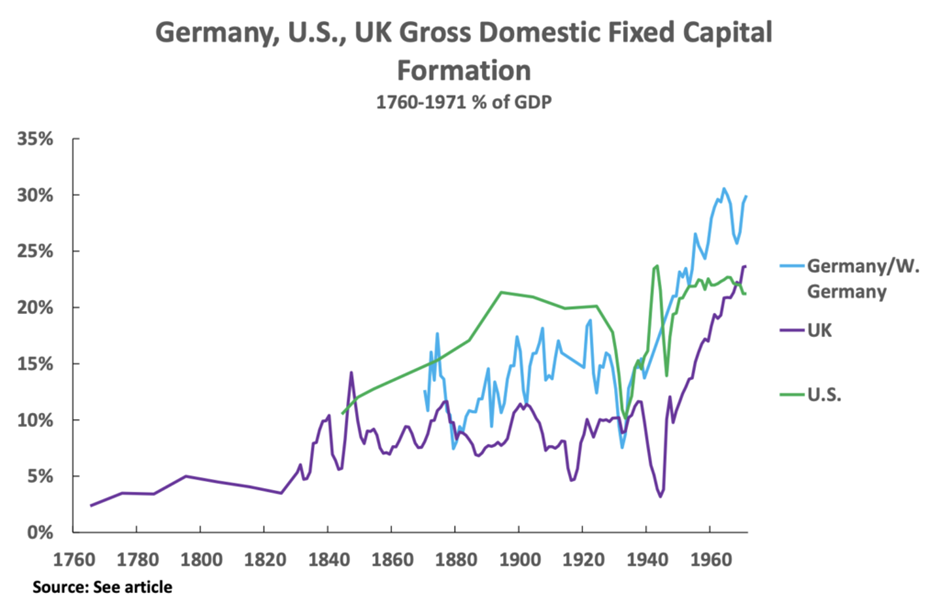
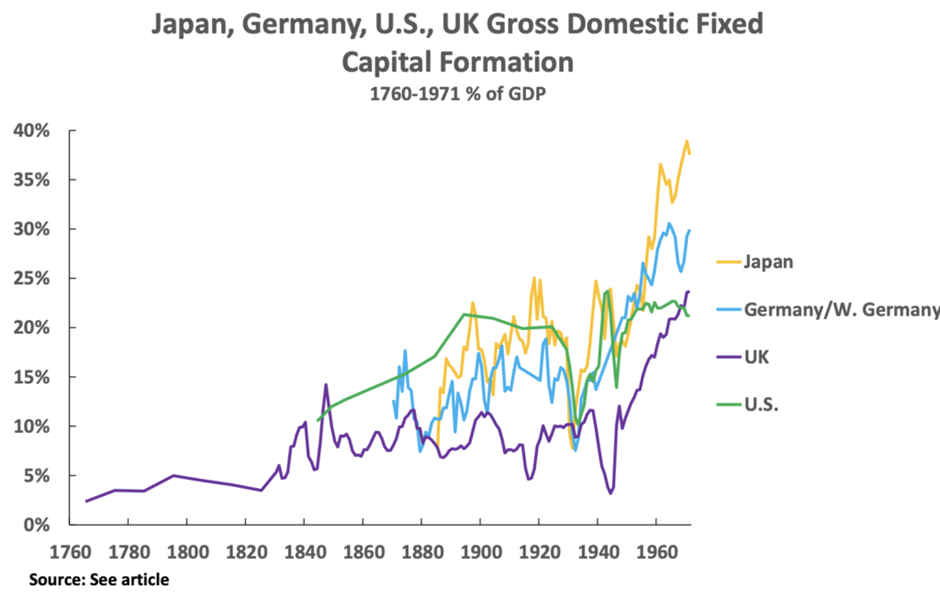
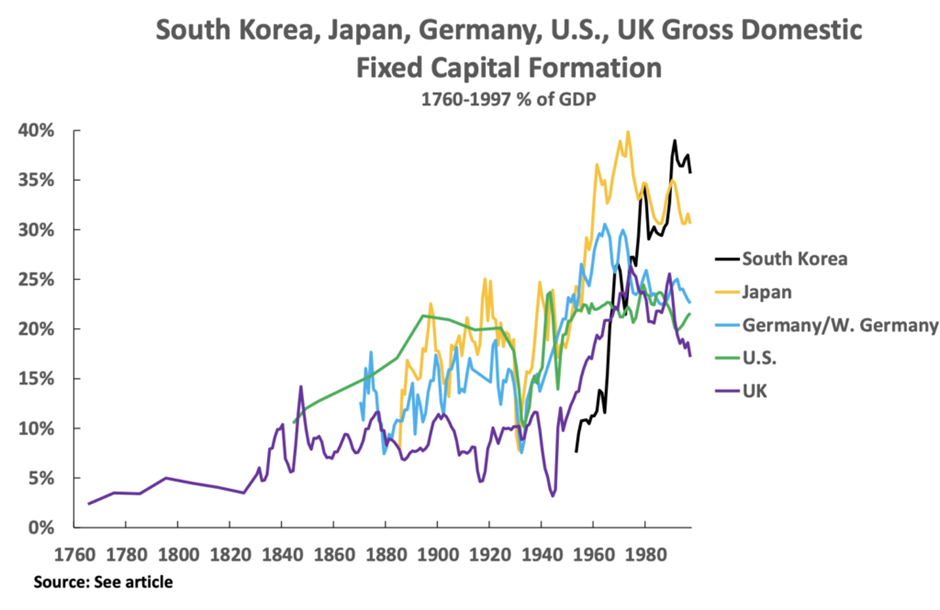
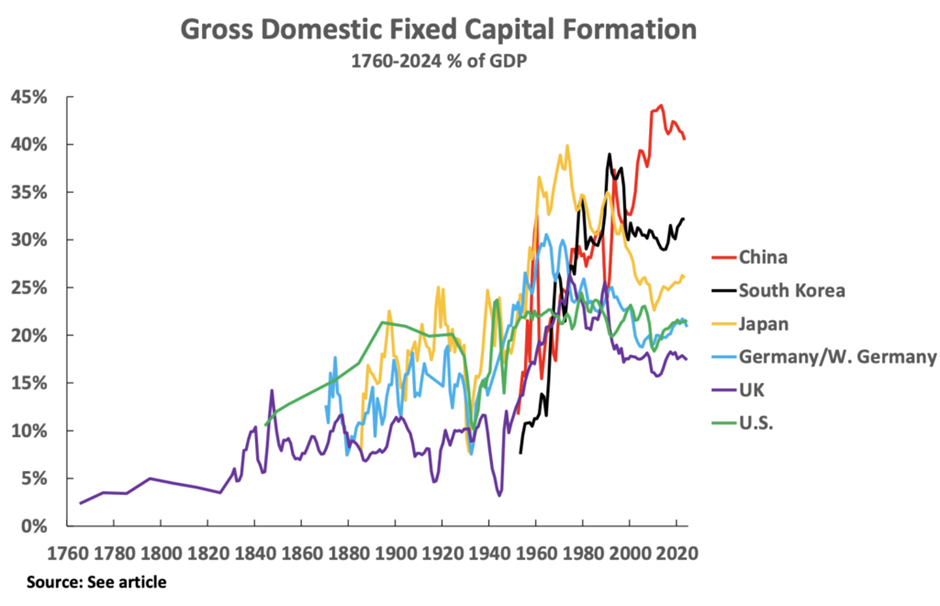
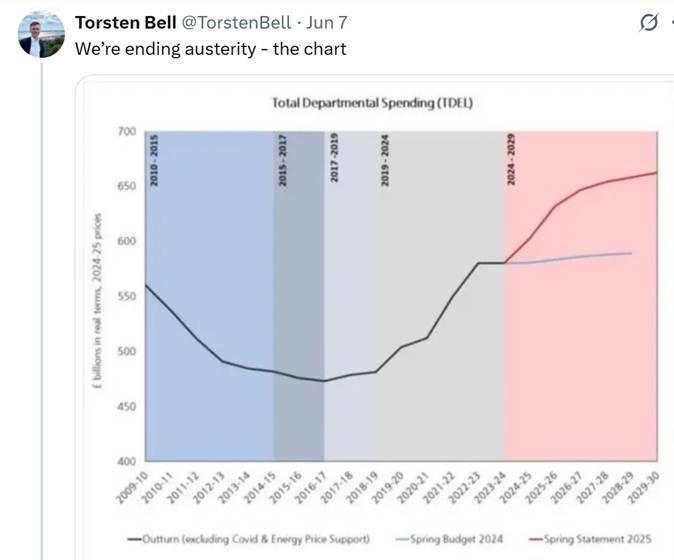
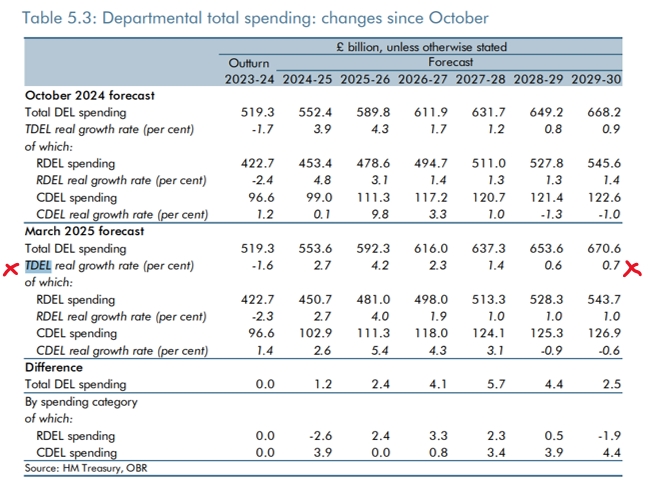
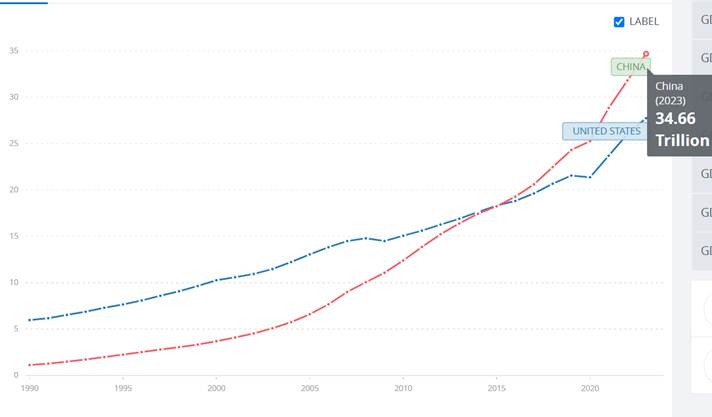
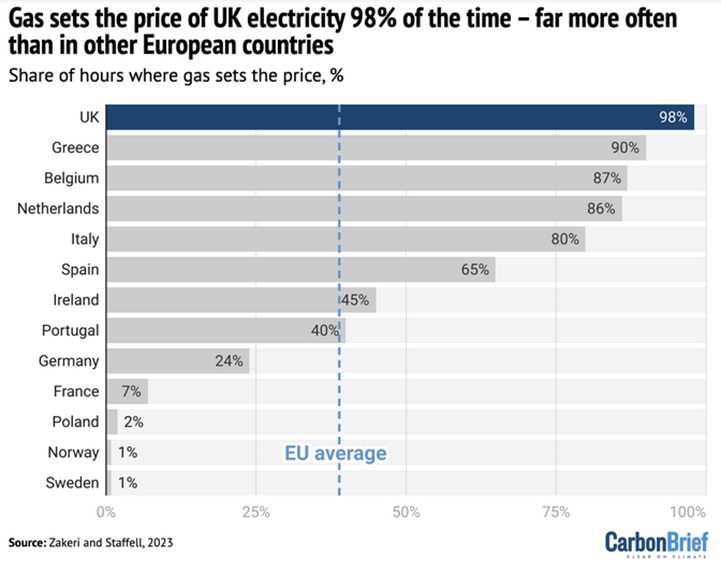
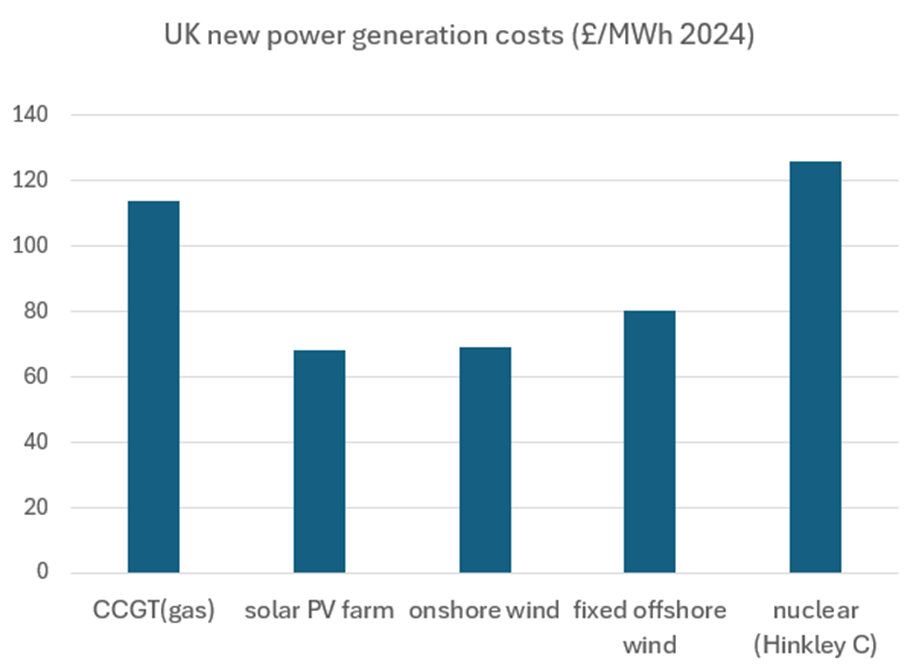
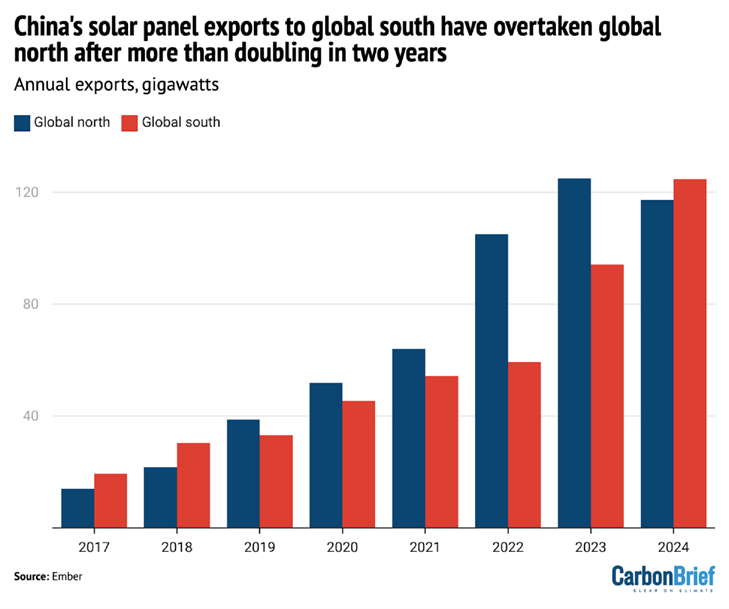
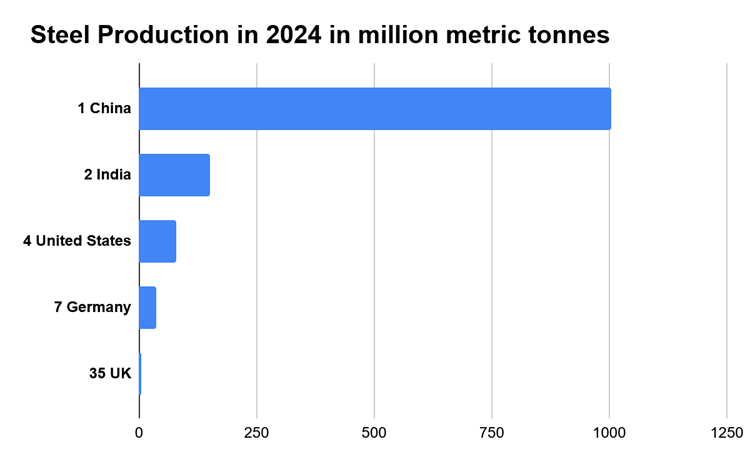
Recent Comments