
.232ZTories have no answer for slowdown. Corbynomics does.
The British economy is slowing down. In the 3rd quarter of 2015 the economy had expanded by just 2.3% from the same period in 2014. This measure removes the volatility of erratic quarter to quarter movements in GDP.
The most rapid pace of growth in this recovery has been the 3.1% recorded in the 2nd quarter of 2014, which mainly reflected government efforts to stoke consumption (particularly in housing) in the run-up to the election. Since that time the growth rate has progressively slowed. This is shown in Fig.1 below. Despite the severity of the recession, at no point has the growth rate matched the higher levels seen before 2008 to 2009.

The slowdown does not mean that a recession is imminent, although this business cycle will come to an end at some point and the global economy is also experiencing some difficulties. The more immediate danger is the effect of government policy and the renewed imposition of austerity policies.
As SEB has previously shown, Austerity Mark II announced in the July 2015 Budget is exactly the same as Austerity Mark I announced in June 2010, a fiscal tightening of £37 billion in both cases. The real effect will be somewhat less this time as the economy has expanded moderately in the interim. Even so, the effect of the first round of austerity was to slow the economic growth rate from a little over 2% year-on-year to 1%. A similar outcome should be expected this time around.
Examining the slowdown
This weakening outlook is the increasing subject of commentary. An article in the Guardian by David Graeber has received a lot of attention. He is a committed opponent of austerity, and all disagreements should always be read in that context. In ‘Britain is heading for another crash: here’s why’ he correctly castigates George Osborne’s economic fallacies, but then supplies a few of his own. As these appear to be widely shared by other progressive economists and opponents of austerity, they are worth debunking.
Graeber argues that any government surplus must entail a private sector deficit. As he correctly states, this is simply an accounting identity and must be true; every borrower requires a saver and vice versa. He goes on to say that the determination to run public sector surpluses is necessarily negative, as it forces the private sector to borrow. He further states that this debt is forced on to those least able to pay it and that this causes recessions, which is often the case.
But in this key passage (using the chart he supplies) he adds, “But if you push all the debt on to those least able to pay, something does eventually have to give. There were three times in recent decades when the government ran a surplus:

Note how each surplus is followed, within a certain number of years, by an equal and opposite recession.”
Note the reason why the surpluses of the private sector do not cause recessions is never explained, nor why we might be entering another recession even though there are still large government deficits.
There are in fact four separate episodes of fiscal surpluses in Britain shown in the chart. Examining them debunks the fallacy that government surpluses cause recessions. The chart used shows the largest surplus of all on the overall fiscal balance in 1948. There was no recession at all until 1974! At the end of the 1960s there was modest surplus, followed by 5 years of continuous growth, and the largest-ever growth rate recorded in a single year, 6.5% real GDP in 1973. The small surplus in 2000 was a result of New Labour sticking to extreme Tory spending plans in the first two years after election in 1997, which was subsequently relaxed. Reasonably strong growth (in British terms) followed and the subsequent crash 8 years later had nothing to do with that surplus. The surplus in the late 1980s was a function of the glut of North Sea oil. This should in fact have been larger, had Government saved this windfall for future investment, as Norway did. Instead, along with Government borrowing it was used to stoke a consumption surge, the ‘Lawson Boom’. The subsequent recession occurred when boom turned to bust. The surplus did not cause the recession – borrowing for consumption while also floating in oil revenues caused an unsustainable boom that inevitably failed.
This argument for permanent fiscal deficits makes no distinction at all between borrowing for investment and borrowing for consumption. The long-run history of the British economy and its decline is in part characterised by the rising rate of Government consumption coupled with a falling rate of Government net investment.
Fig.3 below shows that the strongest rate of growth of GDP in the 1960s was associated with the lowest levels of Government current spending, and vice versa. The higher rates of Government consumption are associated with the slowest levels of growth. The long-term trends are also clear; rising Government spending and declining rates of GDP growth.
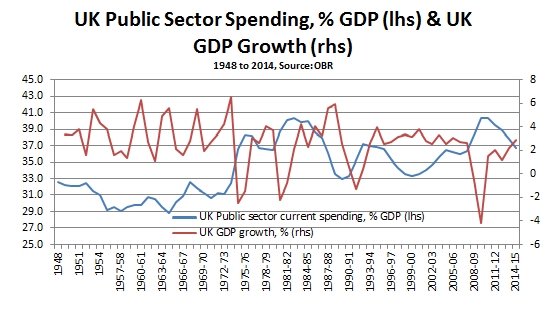
By contrast, high or rising rates of public sector net investment are associated with high or rising rates of GDP growth (again, in British, not global terms). This is shown in Fig.4 below with public sector net investment as a proportion of GDP alongside the rate of growth of GDP.
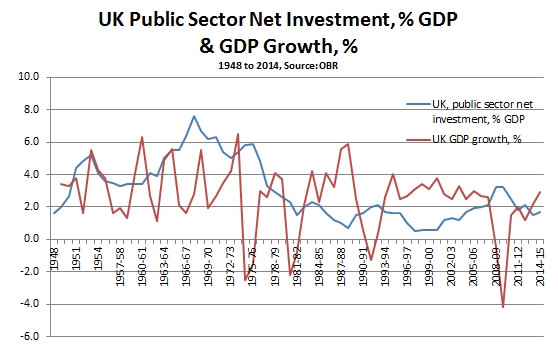
Here, although the GDP data is erratic the relationship clearly trends in the opposite direction; as net investment declines so does the GDP growth rate, and vice versa.
In fact there is a significant negative correlation between public sector current spending and GDP growth of -0.41326. By contrast, there is a very small positive correlation between public sector net investment and GDP growth of 0.1281, which rises to 0.21235 if GDP growth is lagged for 3 years (possibly to account for the economic effects of large projects). But in an economy like Britain’s, public sector net investment is usually too small to determine the overall rate of economic growth.
Fig.5 below shows the rate of GDP growth alongside the proportion of total investment (Gross Fixed Capital Formation) in GDP from both the public and private sectors. Even a cursory glance shows the strength of this relationship and the correlation is 0.7721. It is investment which is the primary driver of growth.
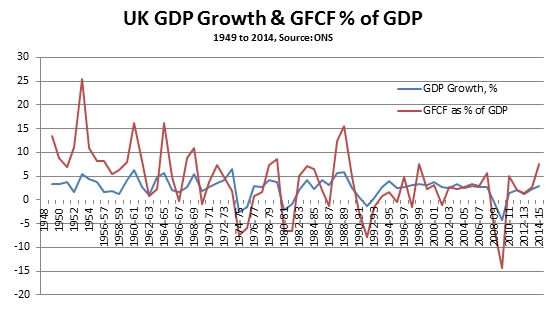
The proportion of GDP devoted to investment (GFCF) is the main determinant of the growth of GDP. But currently the level of public sector net investment is too small to affect the outcome of GDP. At the same time, the level of private sector investment is too weak to support a more robust economic recovery. What can be done?
‘Crowding out’ and Corbynomics
One of the greatest fallacies in modern economics is the notion of ‘crowding out’. This is the assertion that if a level of public sector investment or borrowing is too high then this will prevent the private sector from investing. It particularly came into vogue during the era of privatisations under Reagan and Thatcher and is inscribed in most Western econometric models.
It is a nonsense because it assumes a fixed or steady state economy. But if either the public or the private sector invests in the productive economy, there will be economic growth and so increased funds available for investment.
Over many decades the Western economies have provided ample evidence that the notion of ‘crowding out’ has little basis in fact. Fig. 6 below shows that over the medium-term UK public sector net investment as a proportion of GDP has been cut. In common with most Western economies, the total level of investment as a proportion of GDP has not risen but has actually fallen, although the British case is one of the more extreme examples of both.

It is clear from the chart that public sector net investment leads investment overall. There is a lagged effect, so that the strongest effect of rising public investment on total investment is registered 5 years later. On this basis the correlation between the two variables rises to 0.6820. Far from public sector investment ‘crowding out’ private sector investment, high and/or rising public sector investment ‘crowds’ it in.
This in turn is a significant part of the answer to the question posed earlier, what is to be done if investment is the main determinant of economic growth, yet public sector net investment is currently too small to effect the outcome of GDP as a whole?
The austerity policy is in part a failed answer to this question. It assumes that if wages and taxes on business are pushed down, businesses will increase the proportion of their profits assigned to investment. This has not occurred.
By contrast, Corbynomics has a very different answer. As high or rising public sector investment crowds in private sector investment, the policy response should be to raise the level of public sector investment in order to raise the total level of investment in the economy. The purpose is to raise the sustainable growth rate of the economy and so improve living standards.
If there are future crises of private sector investment, it may be necessary to raise the level of public sector investment once more. But the answer to the current crisis is to increase public sector net investment to a level where total investment is sufficient to sustain much higher, more sustainable growth.
Currently, the level of investment as a proportion of GDP is 20.6% in the OECD as a whole. In Britain it is 16.9%. An immediate objective should be to raise British levels of investment towards that average, so that competitiveness is not further eroded and living standards do not fall further behind. That is the first step towards addressing the current crisis. Future steps will be discussed in subsequent pieces.

Recent Comments