
Austerity has only half worked. New, more radical measures will be attemptedBy Tom O’Leary
The latest GDP data show that austerity has only been effective in driving down wages. It has not been effective at all in boosting profits, which is its purpose. As a continuation of existing policy may simply yield the same results, new and more radical measures will be needed.
Wages down, but profits not up
The purpose of austerity is to increase the share of national income that goes to business and the rich, that is, to boost the profit rate. It has nothing to do with deficit-reduction, which is much more readily achieved by polices that boost growth and thereby increase tax revenues. To boost profits, wages have been frozen or cut, while the total level of social spending has been frozen. Taxes have been cut for business and the rich. So, the UK began the crisis with a main Corporate Tax rate (on profits) of 28%. It is now 20% and is due to fall to 17% in 2020. At the same time, taxes paid by workers and the poor have risen, especially VAT.
But the UK version of austerity has only produced the effect of depressing wages and the incomes of the poor. Real wages have begun to decline once more. But austerity has not succeeded in transforming the profitability of UK businesses. Table 1 below shows the distribution of national income as a proportion of GDP in 2013, when the current very modest recovery properly began. It also shows the proportionate distribution of national income of the £200 billion rise in nominal GDP between 2013 and 2016.
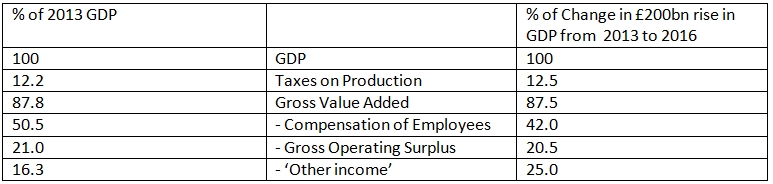
The share of profits (Gross Operating Surplus) has not risen at all. From 2013 to 2016 nominal GDP rose by £200 billion. The Compensation of Employees has risen by just £84 billion. Austerity has been very ‘successful’ in driving down workers’ share of incomes, from 50.5% of GDP in 2013 to just 42% of the change in GDP from 2013 to 2016. (In real terms, the effect of inflation is that total compensation has risen minimally over the period).
But austerity has not been successful at all in driving up the profit share of private corporations. In the financial sector profits have actually fallen even in nominal terms. For non-financial private companies as a whole profits have only just about kept pace with the moderate rise in GDP. There has been no profits bonanza for private producers.
Instead, there has been a sharp increase in the ‘Other income’ share of national income. This includes a variety of income streams, and mixes profits and incomes of the non-profit institutions, households and others. Partly it reflects the growth of spurious ‘self-employment’.
To demonstrate this is not a quirk of using the year 2013 as a starting-point, the same exercise is repeated in Table 2 below. This shows the distribution of national income as a proportion of GDP in 2007, the last year before the recession. It also shows the proportionate distribution of national income in the £409 billion rise in nominal GDP between 2007 and 2016.

The outcome is that austerity has worked to driven down the wage share, but it has not boosted the profits of companies. Without boosting their profits there will be no significant increase in business investment. As raising profitability remains the aim of policy, so further more radical measures will be required.
This government will try to impose radical measures to further curb wages and spending on public goods to boost profits. The mechanism for this will now be the opportunities afforded by Brexit. It seems likely, given the ineffective outcome of policy to date, that this project would have been attempted in any event within the EU. But removing the protections on workers’ rights, the environment, consumer safeguards and so on provides greater room for manoeuvre.
Weak starting-point
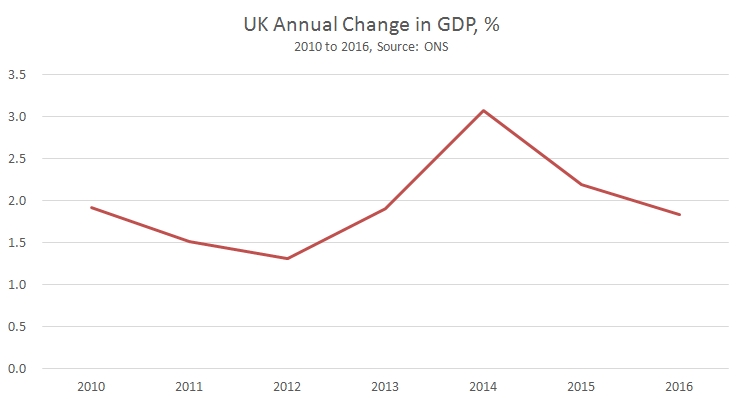
For the year 2016 real GDP grew by 1.8%. This is the second weakest annual rate of growth since the crisis began. Tory government policy temporarily boosted consumption in 2014 as part of its re-election campaign. Growth has been decelerating since.
Real UK GDP growth in 2016 was marginally less than that of the EU as whole (1.9%) and a little greater than the US (1.6%). Of course, it was a fraction of Chinese GDP growth (6.7%).
The effect of the Brexit vote has been mainly felt through a decline in the pound, which has both lifted prices and should boost exports. Those trends will not continue indefinitely. Instead, the act of leaving the Single Market will create a new situation. The GDP data provide evidence of what that new situation will look like and how the current contradictions will be resolved.
Commentators have tended to focus on the rundown in the household savings ratio to a new low of 3.3%. This is an average rate and clearly implies that a large and growing proportion of households are able to save nothing at all or are becoming more indebted.
Household Consumption grew by a full percentage point faster than GDP in 2016, 2.8% versus 1.8%. As Household Consumption accounts for about three-quarters of all Consumption in the UK this would usually mean total Consumption was rising strongly. If Consumption could lead growth this would be a positive development.
For ‘keynesians’ who persist in arguing that Consumption does lead growth, the UK economy is a text book case. Except that the argument is wrong. Strong Consumption has not led to rising Investment, as the ‘keynesians’ suggest. The rise in Consumption cannot be sustained by a persistently declining savings rate. Instead, at a certain point households will decide they cannot or will not continue to support rising Consumption when incomes are not rising as fast and will restrain spending, maybe sharply. Sustained rises in Consumption requires sustainably rising incomes. This is only generally possible if the economy itself is growing.
Falling business investment
Rising growth itself depends on increasing trade and rising investment. Yet business Investment fell in the final quarter of 2016, down 0.9% from a year ago. This is in line with 2016 as whole, where business investment fell by 1.5% from 2015 to 2016. Rising Consumption has not led to rising Investment as Chart 2 shows.

Private Investment is driven by anticipated profits. This is not the same as preceding profits, which businesses judge can and do vary considerably. Chart 3 below shows there is a close correlation between the change in Profits (blue line) year-on-year and the change in Business Investment (red).

As the purpose of private investment is to realise profits, in general changes in profits tend to lead changes in business investment. But in 2016 business investment fell while profits grew very modestly. Businesses expect profits to be significantly lower in future.
Naturally businesses can be wrong. A rise in exports could have a sustained positive impact on production and profits for export. This could be a response to the fall in pound, compensating for the rise in prices and fall in real incomes that is underway.
But there is no evidence that this is the case. Exports rose by 1.8% in 2016, not faster than GDP as a whole. By contrast imports rose by 2.8%. So the trade gap actually widened from £45 billion in 2015 to £52 billion in 2016. Economists speak of ‘J-curve’ effects on the trade balance after currency devaluations. This simply describes a process where the trade balance initially deteriorates and only improves years later as the effect of rising import prices fades and exporters win market share based on lower export prices.
That might be possible, although it would run contrary to established UK custom, where devaluations are used simply to hike prices, while investment is kept low so that any competitive gain is quickly eroded. If UK producers were gearing up for a global export drive, they would be using the windfall of the more competitive currency to restrain export price increases and raise investment. Neither of these two potential developments are taking place. As previously noted, business investment is falling. Remarkably too, UK producers have chosen to raise export prices at a faster rate than the rise in import prices (see Chart 4, below).

Over the medium-term growth is driven by Investment. Without growth, workers would have to engage in enormous struggles in order to increase their wages by wresting capital’s share of total income. Real wages look set to fall further, and will be part of the government strategy for boosting capacity.
Using the Rahm Emmanuel dictum of ‘let no good crisis go to waste’ the government has embarked on a policy which will use the new-found freedom of Brexit to get rid of ‘red tape’ (workers’ rights such as restrictions on the working week or maternity leave, environmental protection and consumer standards).
The claim is that the UK will be moving closer to the Singapore model of development. This is untrue. Singapore’s per capita GDP is US$85,382 versus the UK’s $41,756, according to World Bank data. This primarily arises from two factors. First, Singapore’s openness to trade is nearly 6 times greater than the UKs (326% of GDP versus 56.5%). Secondly, Investment (Gross Fixed Capital Formation) is a higher proportion of that much higher per capita GDP (25.5% versus 16.9%). Contrary to myth, Singapore also exercises a large degree of public control over investment, including outright state investment.
Brexit will not include any of this. In the words of leading leave campaigner Michael Gove, the aim is that the UK’s relationship with the EU will not be like Norway or Switzerland, but like Albania. The UK is severing its links with its closest markets, whereas Singapore has thoroughly integrated itself into the regional South East Asian economy and the rest of the world. In the UK the low level of investment is declining. The state will not be a directing hand over investment. It will be increasingly laissez-faire. In 2012 the Tories commissioned, but were unable to implement the main measures of, the Beecroft Report, calling for the wide-ranging removal of workers’ right.
So far, austerity has ‘worked’ only to drive down wages. It has not driven up profits. New, more radical solutions will be attempted if a real recovery in profitability is to be achieved, facilitated by Brexit.

Recent Comments