
Stagnant economy, falling investment and profits By Tom O’Leary
In order to resolve a crisis it is necessary first to accept that there is one and then to identify its causes. These are indispensable preliminary steps before a solution is found. Unfortunately, Britain labours under a government-sponsored set of delusions about its own economic performance which need to be punctured before rational policy prescriptions can be formulated.
This piece follows a recent one on ‘Britain’s lost decade’ of economic stagnation with annual growth of less than 1% in real GDP over a decade, and its aim is twofold, to prove that Britain’s economic performance is in a crisis, in relative as well as absolute terms, and to show its fundamental driving force, the trend in profits.
Relative performance
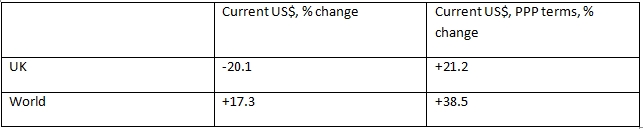
As a measure of the absolute crisis, in per capita terms real GDP has risen in the UK by just 1.7% from its peak at the end of 2007 to the 1st quarter of 2017, which is effectively zero. This is in real £ terms. The UK’s relatively poor performance is shown in Table 1 below, in US$ terms.

In current US Dollar terms the World economy has grown by over 52% more than the UK economy, which in part reflects the repeated devaluations of the pound over the last decade. In Purchasing Power Parity (PPPs) terms, which adjusts for exchange rate differentials, the World economy, which itself has grown exceptionally slowly, has even so grown by almost 19% more than the UK economy over the period.
As a measure of the potential increase in prosperity for the population as a whole, it is useful to focus on changes in per capita GDP. In Table 2 below, the UK has fallen significantly behind the growth in World per capita GDP in both current US Dollar terms, and in PPP terms.
Since the Great Recession both UK real GDP and real GDP per capita have grown far less rapidly than the World economy. The period is characterised by both relative and absolute crisis.
How did we get here?
In the previous article, it was shown how the main factor in the slump is the continuing crisis of investment. Recent data also show the continuing slump in UK productivity. Labour productivity fell in the 1st quarter of 2017. In general, mainstream economists have no explanation for this at all, and the Bank of England has called it a ‘puzzle’. Mainstream economists struggle to explain the crisis, even now.
Recently, the widely followed analyst Frances Coppola ( @Frances_Coppola ) posed the question as to why manufacturing productivity was still falling, and generally received replies that obscured rather than revealed causal relationships. SEB pointed out that the consequence of falling investment is that the stock of capital (the means of production) begins to fall as it is used up in production or becomes dilapidated. This is what has happened in the British economy over the longer-term, most markedly in manufacturing. Chart 1 below shows the level of real manufacturing capital stock in the UK economy.
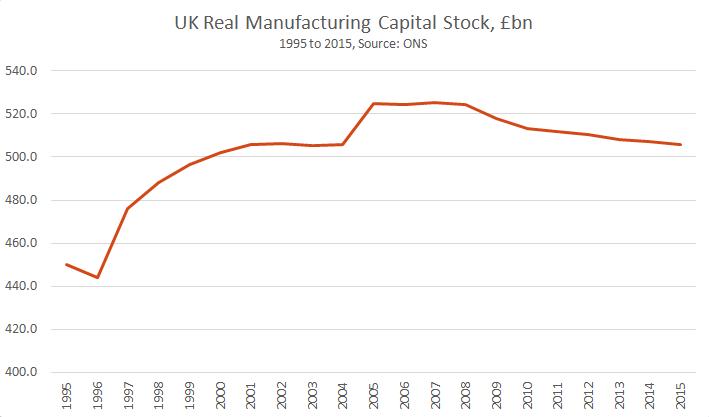

Effectively, the stock of manufacturing capital plateaued between 2004 and 2007. Business was only investing enough to replace exiting stock, not enough to add to productive capacity. From that point on it fell markedly. In 2015 the manufacturing capital stock was below its level in 2001. There is therefore no ‘puzzle’ about falling producitivity or falling output – the manufacturing means of production have been reduced. Manufacturing output is now 2.8% below its pre-recession peak. Over the longer term, manufacturing output actually peaked in December 2000 and is now 4.9% below that level.
More cannot be produced, and it cannot be produced more efficiently in modern manufacturing without investment. The consequence of disinvestment is lower output, lower productivity, lower pay and fewer jobs. But this then poses the question of why investment has fallen, leading to a fall in the means of production.
In an economy dominated by capitalism investment is determined by profitability. Crises of ‘overproduction’, ‘underconsumption’, ‘disproportionality’ between branches of industry, speculative bubbles, and so on, which all appear frequently can all be resolved relatively easily as long as profitability remains robust. But the contrary is also true. There can be no private sector-led recovery without a recovery in profits.
The current slump was caused by a slump in profits. Chart 2 below shows the relationship between UK profits, Investment (Gross Fixed Capital Formation) and GDP. Profits (as measured by the Gross Operating Surplus) in the UK peaked in the 1st quarter of 2006. Investment peaked in the 4th quarter of 2017. GDP peaked in the 1st quarter of 2008. It shows that Profits fell first, Investment followed and then GDP contracted.
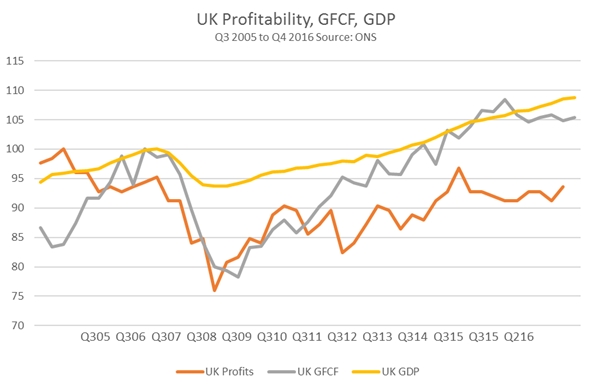
This is not simply a sequential relationship. It is also an arithmetical one. The largest percentage fall was in Profits, followed closely by Investment, and the fall in GDP was much more shallow. From peak to trough, the rate of return for UK non-financial companies fell by 24%. The maximum fall in the level of Investment was 11.7%, while the peak to trough fall in real GDP was 6.1%.
It should be noted that throughout the entire period from the 1st quarter of 2006 to the 1st quarter of 2008 Consumption continued to rise strongly. In fact it did not begin to turn lower until the 3rd quarter of 2008, six months after the recession began.
The recession was driven by the fall in Investment. The fall in Investment was itself driven by the fall in profitability. It is the weakness of Investment which continues to act as a brake on the economy, leading to stagnation or worse. Therefore the trend in profitability takes on decisive quality if there is to be a private sector-led recovery.

Recent Comments