Socialist Economic Bulletin

Latin America Conference 2014

pm Saturday, November 29th

Congress House
Great Russell Street London WC1B 3LS

This years Latin America Conference brings together political leaders, trade unionists, NGOs, academics & progressive movements to explore recent developments across the region, along with films, music and exhibitions showcasing Latin American culture.

With special guests:
• Aleida Guevara, daughter of Che
• Juana Garcia, Venezuelan Women’s Ministry
• Alicia Castro, Argentinian Ambassador
• Guillaume Long, Senior Ecuadorian Government Minister
• Guisell Morales Echaverry, Nicarguan Charge d’Affaires

Plus:
• Miguel Angel Martinez, former Vice-President, European Parliament
• George Galloway MP
• Chris Williamson MP
• Christine Blower, NUT General Secretary
• Kate Hudson, CND
• Andy De La Tour, Actor
• Tariq Ali, writer
• Owen Jones, writer

And films, stalls & discussion on topics such as:
• Cuba: building a better world under the eye of the empire
• After Chavez – the Empire strikes back in Venezuela
• Nicaragua, 35 Years on – the second Sandinista Revolution
• For Peace, Development & Progress – the new Latin America in the World Today

What do Britain’s private sector firms contribute?

.708ZWhat do Britain’s private sector firms contribute?By Michael Burke

The main factors that account for economic growth are increases in the workforce or in the amount of productive capital in the economy. A far smaller contribution is made by improvement in productivity as a result of innovation, which is known as Total Factor Productivity.

Since mid-2009 the British economy has grown. But this is wholly accounted for by growth in the workforce, which made up of both an increase in the number of people in work and in the number of hours they work. As a result the average person in work cannot experience any improvement in living standards as economic growth is simply made up of more people working longer hours. Worse, those on very high pay, senior executives and shareholders, have claimed any benefits of that moderate growth in the British economy. Average real pay continues to decline.

The missing element in Osborne’s so-called recovery has been growth in productive investment. The ONS chart below shows the level of Net Fixed Capital Formation in the British economy from 1999 to 2013 as a proportion of GDP. Usually Gross Fixed Capital Formation (GFCF) is the main indicator of investment that is discussed. But Net Fixed Capital Formation deducts the capital consumed in the production process itself. While GFCF includes replacement of machine tools, or software and repairs to a factory, NFCF is a measure of only the net addition to new machine tools, software or factories after any replacements have been deducted.

NFCF therefore measures the addition to the accumulated stock of capital. (Unfortunately it also mixes together productive capital, such as machinery, with unproductive capital such as housing, but this failing cannot be addressed in this piece). The chart also shows the contribution to NFCF from each sector, non-financial firms, financial firms, government and households.

Fig. 1 Net Fixed Capital Formation, % GDP
Source: ONS

The data is worth examining in detail. The net contribution of financial firms can be disregarded as it is negligible in all cases. But it is also clear that the contribution of non-financial corporations (NFCs), i.e. private companies, has been far from overwhelming.

Table 1. Contributions to Growth in Net Capital Stock by Sector, % GDP
Source: ONS

In most years before the crisis the net contribution from non-financial firms was matched or surpassed by the contribution from households (and the non-profit sector NIPISH). The strongest year for the net growth in the capital stock was 2004, when the greater role was played by government and non-financial firms contributed just one quarter of the total growth. But this increase in government spending encouraged the private sector and the following year saw an increase in the contribution to NFCF by private firms. But from that point onwards until 2009 government NFCF was once again reduced and in turn, with one year time lag, companies duly cut their own level of investment. With a time lag, companies also followed when government increased its investment again after 2008. Yet non-financial firms never contributed as much as half of the net growth in the capital stock in any year over the period.

Outlook

The coalition government has been claiming that it has overseen a revival of the British economy, including business investment. But the total proportion of NFCF is barely changed from the crisis year of 2008, along with the contribution from non-financial firms. In reality, it was the modest increase in government net investment in 2009 which rescued the economy and has been responsible for well over half the growth in net investment since. Non-financial firms have contributed less than a third of the NFCF over the same period. Yet the Coalition cut the level of investment it inherited from Labour and has only increased it modestly to avoid the political consequences of a renewed recession.

Over the longer-term Britain has a very low level of net capital formation, less than 2.5% of GDP at its recent high-point, which condemns the economy to slow growth. Even among the Western economies that have experienced a decline in growth rates over the medium term, Britain has had one of the lower levels of NFCF. It is notable too that the US has among the weaker levels of net investment growth since 2006, which belies notions about a US industrial renaissance.

Fig. 2 Net Fixed Capital Formation in Selected Economies, % GDP
Source: ONS

Unfortunately, the Thatcherite and Reaganite notion of the ‘state getting out of the way of the private sector’ still dominates thinking in most Western economies. This turns reality on its head. Private firms are an important but minor player in the growth of the net stock of capital. They are led by the activity of the government. This was decisive during the crisis and there is no prospect of a return even to previous levels of British growth if it is mainly dependent on the contribution of private firms. The austerity consensus remains that government must cut back while we await the decision of private firms to increase their investment. This will condemn the economy to prolonged stagnation.

British firms’ cash hoard is over £500bn

.520ZBritish firms’ cash hoard is over £500bnBy Michael Burke

The source of the current crisis is the unwillingness of private firms to invest. Instead, they are hoarding cash that could otherwise be invested. The latest data shows that this cash hoard stood at £501.9 billion at the end of 2013. It has almost certainly risen since.

The latest ‘flow of funds’ data from the Office for National Statistics (ONS) provide comprehensive data for the financial flows between each sector of the economy. They show how the cash mountain has been created. Via the banks, these data show how the incomes of firms (mainly profits) or of individuals (mainly wages) can become savings and may be used for investment.

If a capitalist economy is functioning in the textbook manner, firms will generate profits which they use for their own investment. Through bank borrowing they will also be able to use the savings of private individuals to supplement that investment. It is the supposedly efficient and large-scale way that this takes place that gives the capitalist economy its particular power, and the pre-eminence of the private sector within that, including the banks.

But this is not what is happening in the British economy. The ONS chart below shows the savings and investment levels private non-financial firms (all private corporations excluding banks, insurers and so on, or PNFCs). These are shown from 1997 onwards as a proportion of GDP.

Fig.1 Net lending and investment of PNFCs as a proportion of GDP 
Source: ONS

Over a prolonged period from 2001 to 2013 private firms in Britain have been net savers. Far from borrowing from another sector such as households (or from overseas, or government), private firms have been saving not borrowing. The peak level of this net saving was 4.3% of GDP in 2011. The recent high-point for firms’ borrowing was a not very high level of 2.8% of GDP in 2000. The difference between those two levels is 7.1% of GDP. This is significantly greater than the actual annual contraction in output during the recession and entirely accounts for it.

At the same time private firms have been cutting their levels of investment. Firms’ productive investment (Gross capital formation) peaked at 12.4% of GDP in 1998. It fell to 7% at the low-point of the recession in 2009, and the rebound since has only been to 9.2% of GDP. This is actually below the level of capital consumption in the economy (the capital consumed in the course of production). As a result British firms are not net producers of capital.

It is the savings of private frims which have produced the cash mountain. The growth of the cash hoard is shown in Fig.2 below both in terms of billions of pounds and in propprtion to GDP.

Fig.2 The cash hoard of British firms

A number of reasons have been advanced for the growth in the cash mountain, including increasing complexity of global supply chains, greater uncertainty and other factors. They are generally unconvincing, not least because the growth in the cash hoard has coincided with both record shareholder returns and senior management rewards.

Companies in Britain and in the Western economies generally are content to retain or even increase high debt levels in order to fund share buybacks and extraordinary boardroom pay. They are not prepared to invest even their own profits, much less borrow to invest.

The cash hoard is directly related to profitability. Firms will not invest while they do not anticipate sufficent returns on that investment. As a result, the cash hoard will grow until they do.

Yet it is clear that the idea that ‘there is no money left’ for investment is false. The money is simply in the hands of those who refuse to invest it. What is required are measures that will wrest it from them in order to fund investment.

There is a ‘magic money tree’ – it’s investment

There is a ‘magic money tree’ – it’s investmentBy Michael Burke

Supporters of austerity have long argued that there is no viable alternative because of persistent government deficits and rising debt. David Cameron put it starkly arguing that ‘there is no magic money tree’.

However these assertions contain two important fallacies. First, it is evident that, if government is increasingly indebted it must be the case that the private sector is also an increasing owner of that government debt- government cannot be a net debtor to itself. Therefore rising government debt represents a transfer of incomes, from the public sector to the private sector.

Secondly, economies can grow. Otherwise human society would still be in its most primitive phase. Therefore there is no fixed amount of output in the economy, or the monetary denominator of that output.

IMF answer

The question posed is therefore, how can a cash-strapped government grow the economy and improve its own fiscal position? The IMF has arrived at an answer. In the latest widely-read World Economic Outlook (WEO), the IMF devotes an entire chapter to the merits of public investment in infrastructure, which it defines as transport, power and other utilities and communications systems. The paper ‘Is it time for an infrastructure push? The macroeconomic effects of public investment’ can be found here (pdf).

Investment is one of the essential components of growth. Private sector investment is driven by the anticipated profit, but it has no magic wand to conjure returns from investment which the public sector does not possess It is possible for government to benefit from the returns on investment in the way that the private sector can. In fact there are additional returns on investment to the public sector that are not available to the private sector at all, in the form of increased tax revenues and lower social welfare payment from increased economic activity.
The key points of the IMF research can be summarised as follows:

  • The stock of public capital, which is mainly responsible for total infrastructure, has declined across all categories of economies over the last three decades
  • There is now a substantial shortfall in both the quantity and quality of public capital
  • There are very high returns available to the public sector from investment in infrastructure
  • In periods of low growth the immediate effect of an increase in investment in infrastructure is a return of one and half times the initial investment, which rises to three times over the medium-term
  • The positive effects of investment are larger when they are financed by debt rather than by budget-neutral cuts elsewhere
  • The positive effects are also larger when they are supported by monetary policy
  • There is little or no evidence that the government’s cost of debt increases when debt is used to fund infrastructure investment
  • In terms of what the IMF calls ‘emerging markets’ this means that the effects of investment are far higher when funded by international loans, rather than transfers from other parts of national budgets (the so-called ‘fiscal policy rule’ usually demanded under IMF country programmes).

The research paper also presents a stylised version of its results for the advanced industrialised economies in the current phase of the economic crisis. The results are shown for the change in GDP and the change in government debt as a percentage of GDP arising from a 1% increase in public infrastructure investment, in Fig.1 below (data from Fig.3.9 in WEO).

Fig. 1 Effects of a 1% GDP increase in public infrastructure investment
Source: IMF

The central estimate is that there would be an immediate increase in GDP and an immediate decrease in government debt arising from infrastructure investment, and that these accumulate over time. By the end of the period 2023 the research estimates that a 1 per cent of GDP increase in public infrastructure investment would raise GDP by 2.8 percent and that government debt would have decreased by 1.75 percent.

Although the IMF does not do so, the same logic could be applied to any investment which increases the productive capacity of the economy, most especially education. Public investment produces growth, which produces lower debt and deficits. Similarly, the IMF research does not explore the mechanisms by which this can be achieved. In those economies where there is a greater weight of public sector corporations, where firms and banks are under public control, they can be a direct conduit of increased state investment. The greater the weight of public corporations, the greater the government’s ability to both increase the level of investment and to regulate it.

What’s stopping them?

IMF research papers are often regarded as very authoritative, but they are not uncontroversial. Much earlier in the current crisis another WEO research chapter (‘Will it hurt?’) argued that austerity policies would be hugely damaging, depress growth and so prevent any significant improvement in government finances. This judgment has been demonstrated to be essentially correct.

Yet austerity has been implemented in most advanced industrialised countries. The effects have been so negative that for many this is the weakest recovery on record, government debt burdens have hardly lifted and now many commentators, the IMF included, are concerned about the prospects for a renewed slowdown.

Neither can there be any confidence that the most recent research will lead to a sharp increase in public investment. The key obstacle to that is hinted at in the IMF research paper. There are a number of references to the impact on private sector investment arising from an increase in public investment (‘crowding out’ effects), even though these are generally downplayed.

This might seem odd. As the authors note, across all types of economies the bulk of investment in infrastructure is made by the public sector. There is an infrastructure deficit and only the public sector can reasonably be expected to fill it. Furthermore, there is a widespread insistence that reducing the level of public debt and deficits must be the overriding or even sole objective of economic policy. As the IMF research shows public infrastructure not only increases GDP but also lowers government debt. Under these circumstances, the marginal impact on private investment levels ought to be immaterial.

However, the entire austerity policy has not delivered growth or improved government finances, exactly as the earlier IMF research warned. The governments continuing to pursue it, as in Britain, are not foolish. Austerity has another purpose. This is to restore the rate of profit for firms. If large scale public investment in infrastructure risks even a minimal reduction in private investment (as the IMF says is possible, but not likely under current circumstances) then it will be fiercely resisted by those firms and those acting on their behalf.

This explains why political parties who talk about growth and deficit-reduction are wedded to an austerity policy which delivers neither. It also explains why all the forces arguing for an end to austerity and for state-led investment should expect a long struggle ahead.

Productive investment has not increased, so there is no sustainable recovery

Productive investment has not increased, so there is no sustainable recoveryBy Michael Burke

The latest GDP data showed that the British economy is a little stronger than previously thought. The economy is now 2.6% above its previous peak in the 1st quarter of 2008 and surpassed that peak in the 3rd quarter of 2013.

However, the fundamental character of the current crisis is unaltered by the revised data. The Office of National Statistics (ONS) is correct to state that, ‘The worst recession since our records began in 1948 has been followed by the weakest recovery’. The path of the current recovery is shown in Fig.1 below, an ONS chart which compares the level of GDP in previous recessions.

Fig.1 GDP levels (quarterly) from peak for previous and latest economic
Source: ONS

This very weak recovery is also confined to the services sector of the economy. All other sectors of the economy, manufacturing, production and construction remain in a slump. This is shown in Fig. 2 below, which records the change in the sectors of the economy from the beginning of the recession.

Fig. 2 GDP levels (quarterly) for output components
Source: ONS

It is clear from this chart that there was a severe ‘double-dip recession’ caused by austerity which affected the productive sectors of the economy excluding services. A number of service industries were boosted by a combination of ultra-low interest rates and specific measures adopted by the government to boost consumption. The industries to benefit included finance, and retail and business services. Far from a ‘march of the makers’ promised by Osborne, the current situation is repeat of the errors of the Lawson Boom and the ‘candy-floss economy’, on a much weaker basis. The former Tory Chancellor argued that it was immaterial that manufacturing was collapsing under Thatcherism as long as there were overseas buyers of any good or service produced in Britain (including candy floss, in reality financial services). This was before the boom turned to bust.

The disparity shown in the different sectors of the economy is a function of the great divergence in the components of GDP. All the main components of GDP have now surpassed their level when the recession began in 2008 except for investment. Household consumption, government expenditure and net exports are all higher, only investment (Gross Fixed Capital Formation, GFCF) remains below its previous peak. The change in GDP and its components in the recession is shown in Fig. 3 below.

Fig.3 Change in Real GDP & components since the recession began
Source: ONS

Key parts of the service sector can grow without significant investment, at least for a period. Industry, manufacturing and construction cannot. Investment is the main brake on the economic recovery. It is not the case that the crisis is caused by a deficiency of ‘demand’. Both household and government consumption have risen but investment is still below its previous peak. Previously, the decline in business investment was mainly responsible for the decline in GDP. But that is no longer the case.

Business investment declined far more sharply than the economy as a whole, down 23% from the peak to the low-point in 2009, compared to a 65 decline for GDP. But it has now made a feeble recovery in line with GDP.

Now it is government investment which accounts for the decline in fixed investment. Even taking into account the highly seasonal variability in government spending, the current level is 15.5% below the peak. The absolute decline (not taking account of seasonal variations) is 54%. The change in real business investment and the main component of government investment (not including investment by public corporations) is shown in Fig. 4 below.

Fig.4 Real Business and Government investment, GFCF
Source: ONS

This illustrates a central plank of the austerity policy. The decline in business investment proceeded the recession, driven by a declining rate of profit. (This point ought to be wholly uncontroversial as even the mass of profits fell in nominal terms at the beginning of 2006). After the fall in profits in 2006 the level of investment in the productive sectors of the economy began to decline and then fell rapidly producing the recession. For the period which includes most of 2006 and 2007 this decline was masked by the last stages of a housing and financial bubble. The level of real investment in the productive sectors is shown in Fig.5 below.

Fig. 5 Real productive investment
Source: ONS

This important decline in the productive capacity of the economy is masked by the statistical practise of referring to Gross Fixed Capital Formation in its entirety, which includes both productive investment and other large items such as residential investment and the transaction costs of investment in buildings, including estate agents, surveyors and the like. While these may be necessary and can provide a social good, they do not increase the productive capacity of the economy.

None of the productive sectors has yet seen a recovery in the level of investment from their peak level. Investment in offices and factories is the largest component and is 16.4% below its previous peak, a fall of £23.1bn.

There is therefore no ‘puzzle’ at all to the crisis of productivity in the British economy. The productive capacity of the economy is not growing and may even be declining once capital consumption and real depreciation are taken into account. If more labour is deployed, which is the case currently, output can increase. But if the productive capital of the economy is stagnating or even contracting, then this can only be reducing average output per hour. This is the underlying cause of the crisis of living standards and of real pay. Workers are working longer in less productive ways and so are being paid less.

The austerity policy includes a deep cut in government investment with the false assertion that the private sector will fill the gap. Evidently this has not occurred. The fact is that the fall in government investment is now the largest single impediment to recovery. Given the interrelationship between government and the private sector, this will have a depressing effect on private sector investment. The reverse is also true. A large increase in government investment would lead the whole economy to a sustainable recovery.

Is Ireland experiencing a boom?

Is Ireland experiencing a boom?By Michael Burke

The economy in the Republic of Ireland expanded by 1.5% in the 2nd quarter and by 6.5% from the same period in 2013. This leaves the economy well below its previous level but is actually much stronger than the annual growth rates in the same period in Britain’s ‘boom’, of 0.9% and 3.2%.
For a number of decades the Irish economy has grown more rapidly than the British economy and per capita GDP is higher in the Irish Republic. According to the OECD this is true if constant prices and Purchasing Power Parities are used, or whether current levels are used for both.

This relative outperformance is likely to continue in the future. This is because the Irish economy is more thoroughly integrated into the world economy (or, put in classic terms, it has a higher participation in the international division of labour). This is true even taking into account the effect of multi-national corporations booking profits in Ireland based on production that takes place elsewhere.

The British economy too has its own mechanisms for facilitating international tax avoidance, including the network of overseas territories Guernsey, Jersey, Gibraltar, BVI and so on.
Once this ‘soufflé effect’ is removed it is clear that the export of goods from Ireland is a vastly greater proportion of GDP than are British exports. This, combined with the tendency for an increase in the international division of labour, which is expressed as the faster growth of world trade than domestic GDP, means that the Irish economy is set to grow faster than Britain over the longer term.
But faster growth than Britain is a poor yard-stick. It is utterly foolish of British supporters of austerity to gloat over the relatively better performance of the British economy than the French economy. Declining prosperity elsewhere does not constitute economic well-being here.

Similarly, the focus should be on what is the maximum sustainable growth rate for the Irish economy and the mechanisms to achieve that. In light of the Irish economy’s degree of integration into the world economy, the current rebound in Irish GDP falls well short of what is possible or desirable.

A version of the article below first appeared on Irish Left Review under the title Investment Remains the Key to a Real Recovery.

===============================================================

The Irish recession which began in the final quarter of 2007 is the most severe in the history of the state. GDP contracted by 12.1% in a little over two years ending in the 4th quarter of 2009. That slump is not over. The latest data for second quarter of 2014 show that the economy still remains 3.4% below its pre-recession peak. In effect it is likely to take 5 years or more simply to recover the output that was lost in in the slump.

Even then, the economy will remain way below its previous trend rate of growth. This is illustrated in Fig 1 below, which shows real GDP and real GNP from 1997 to the present. The average annual growth rate of the Irish economy from 1997 to 2007 was approximately 6%. Maintaining the trend rate of growth would have led the economy to be approximately 50% larger than it is currently, and there is a danger that this potential is lost permanently.

Fig.1 Medium-Term GDP & GNP

The causes of the slump are very clear. Over the entire period of the crisis the fall in investment more than accounts for the entirety of the decline in aggregate measures of output, either GDP or GNP. GDP in the 2nd quarter of 2014 is still €6.6bn below its late 2007 peak. Investment (Gross Fixed Capital Formation, GFCF) is €14.4bn below its peak. There are other components of GDP which have also failed to recover, notably personal consumption and government expenditure. But even taken together, their combined fall of €10.1bn is less than the fall in investment. The only component of GDP which has risen is net exports. The change in components of GDP is shown in Fig.2 below.

Fig.2 GDP & Components In the Slump
Source: CSO

This data belies the notion that there is an ‘export-led recovery’ under way. Recorded net exports have grown very strongly, up €30.5bn over the period. But only one quarter of this or €7.4bn is a rise in the export of goods. A much larger statistical contribution has arisen from the decline in the imports of goods, down €14.6bn. As both investment and consumption have fallen, this simply suggests that both firms and households have been priced out of world markets by reduced purchasing power. The remainder of the rise in net exports is derived from international trade in services. These are particularly prone to the tax-induced flow of funds that plague the Irish economy and completely distort the economic data. There is little benefit from attempting to unravel them.
More importantly, it is clear that exports have not led a broad-based recovery at all. All the main domestic indicators of activity, consumption, government spending and investment are still far below their pre-recession peaks.

The recovery

The low-point for the Irish economy was reached in the 4th quarter of 2009. There is not yet a recovery. But there is a rebound from that low-point, which has not always made smooth progress. Every year since 2009 has seen at least one quarter of economic contraction. It is hoped that 2014 will be different.

One reason for this volatility in the data is the activity of multinational corporations. For example one large order for aircraft, none of which are produced in Ireland but are booked in this jurisdiction, can provide a large one-off boost to GFCF and to GDP.

The engine of the recovery is also clear if we take the inflection point from the 4th quarter of 2009 to the most recent data. This is shown in Fig.3 below.

Fig. 3 Change in GDP & Components in the recovery
Source: CSO

The rebound in both GDP and GNP since the end-2009 low-point is driven solely by the rise in net exports. Of the €24bn rise in net exports over that period just €8bn is a rise in the net export of goods.
Otherwise there has been no improvement in the other components of GDP even during this phase. Personal consumption and government expenditures have fall by a combined €2bn. Again, this is exceed by the fall in investment, down €2.7bn since the end of 2009.

The motor force of the Irish economic slump has been the fall in fixed investment. Ireland’s openness to the world economy (its high degree of participation in the international division of labour) provides a real benefit to the economy, even if that is vastly overstated in the official data.

But for exports to lead the economy investment must grow. Otherwise Irish goods (and genuine services) become priced out of world markets. The investment strike in Ireland has not ended. Until it does there can be no confidence in the sustainability of any eventual recovery.

Austerity is on course to be a lot worse

Austerity is on course to be a lot worseBy Michael Burke

The Office for Budget Responsibility (OBR) has produced its latest assessment of the economic crisis and its impact on government finances (pdf here). In common with the UK Treasury the OBR tends to underestimate the impact of austerity policies and consequently has a persistently over-optimistic outlook for the British economy. This is no surprise as the OBR uses the Treasury economic model.
Even so the detailed analysis by the OBR is very valuable as it reflects official thinking on the economy and on economic policy. This view will continue to be shared by the OBR and Treasury beyond the next election.

A key conclusion of the latest report is the assessment that austerity policies are set to continue for some time to come. The chart below shows the OBR’s assessment of the austerity policies and their composition from 2008/09 with projections until 2018/19. The policy measures of government spending cuts and tax change changes are expressed as a percentage of GDP.

Fig.1
Source: OBR

The OBR persists in projecting the effects of Labour policy over the entire period even though the Coalition has been in office since May 2010. Labour’s austerity measures (announced by Alistair Darling in March 2010) are shown in purple. The additional measures introduced by the Coalition in June 2010 are shown in green. The further measures after that time (beginning with the Austumn Statement in 2010 and March 2011 Budget) are shown in orange.

Currently we are approximately midway through the Financial Year 2014/2015, when the fiscal tightening rises from 5.1% of GDP to 5.6% of GDP. So the current fiscal tightening is approxumately 5.35% of GDP. By 2018/19 the OBR projects the entire austerity policy will reach 10.3% per annum.
In effect we are currently only half way through the austerity programme.

At the TUC, Geoff Tily points out that that the entire OBR analysis is based on an incorrect framework (adopted from the Treasury). This framework assumes that austerity reduces the deficit while doing little damage to the economy. Yet the OBR’s own data show this assumption is incorrect.

The data below is extracted from the OBR’s Chart 1.3 in its latest report. It shows the level of Total Managed Expenditure versus Current Receipts as a proportion of GDP during the entire period of the crisis to date.

Fig.2  Expenditure & Receipts, % GDP
Source: OBR

Since FY 2008/09 expenditure has fallen by just 0.6% while receipts have also fallen by 0.2% of GDP. The OBR forecasts that this will improve imminently, but forecasts of that type have been made ever since the OBR was established. The latest data for the current Financial Year actually show the deficit widening once more. The effect of austerity policies is to produce the weakest recovery on record while the reduction in the deficit has been minuscule. If 5% or more fiscal tightening has been required to reduce the deficit by just 0.4%, the OBR projections of further policy measures shown in Fig. 1 are likely to be a significant underestimate.

A continuation of austerity policies is unlikely to produce a different outcome. Unless there is a radical break with OBR/Treasury thinking, austerity is set to get a lot worse.

Austerity killed off improving productivity. Investment is needed to revive it

Austerity killed off improving productivity. Investment is needed to revive itBy Michael Burke

Supporters of government austerity measures have been quick to claim that recent revisions to GDP growth show a much shallower recession and much stronger recovery than previously thought. These claims are factually incorrect. The Office for National Statistics (ONS) accurately summarised the effect of its revisions as follows,

“Although the downturn in 2008-2009 was shallower than previously estimated and subsequent growth stronger, the broad picture of the economy is unaltered. It remains the case that the UK experienced the deepest recession since ONS records began in 1948 and the subsequent recovery has also been the slowest.”

The current situation for the British economy is characterised by an exceptionally weak recovery. The actual increase in output is minimal, much worse than any previous recovery. The very slow improvement in GDP is a product of more people working longer hours for less pay.

In the most recent reassessment of the data, the ONS noted the continuing exceptional crisis of productivity (the amount produced per hour of work). This is shown in Fig.1 below. The dotted line shows the previous trend growth in productivity. The unbroken light blue line shows the previous ONS data and the dark blue line shows the most recent revision.

Fig.1 Output Per Hour and trend
Source: ONS

It should be noted that productivity had been growing very moderately from the end of 2009 until the Coalition’s austerity policies began to take effect at the beginning of 2011. There has been no recovery since.

This is far worse than any previous recovery, as shown in Fig.2 . It is unprecedented in Britain for productivity to be lower than the pre-recession peak 6 years previously. But that is what the previous estimate (unbroken black line) shows. The more recent revision (broken black line) is slightly better but is unlikely to alter the main trend.

Fig.2 Output Per Hour, comparisons with previous recovery periods
Source: ONS

In the average of previous recessions and recoveries, productivity was 16.3% higher 6 years after the recession began. The complete data for the current slump is yet to be published. But if it is still below the pre-recession level (as seems likely) then the gap between the current trend in produtivity and the recovery from previous recessions could be in the order of 17% or 18%. There is also no sign of improvement.

If output per hour does not increase it is exceptionally difficult for average pay to increase. That would require a sharp rise in labour’s share of output, which is extremely rare when output is not expanding. This is the cause of the wage crisis in the British economy.

In a market economy there are also great difficulties in raising social expenditure when there is no growth in productivity. In any event is impossible to both raise wages and increase spending in education, health, transport, housing and so on if there is no increase in output per hour.

The cause of the productivity crisis is no puzzle. Just as a heavy load can be lifted much more quickly by machinery than by hand, productivity increases with the amount and sophistication of the capital machinery that is used. Cutting back on that equipment, by refusing to invest and/or letting existing machinery dilapidate will reduce output per hour. This is what has happened in Britain and many other western economies.

The argument that all that is required is increased demand is false. The final up-to-date data for the British economy will certainly show that demand, both household and government consumption have recovered since the recession. But investment has not. Increasing consumption by reducing investment is the road to impoverishment.

Private firms do not exist to satisfy demand, but to accumulate profits. Currently they remain uncertain about profits, and there is growing opposition to increased private investment.

But government has no such constraints. It can invest because the investment is necessary and reap returns not available to the private sector in the form of increased tax revenues and lower social security payments. State-led investment is needed before the crisis can be ended.

Austerity is the cause of the crisis in France. Investment can end it

Austerity is the cause of the crisis in France. Investment can end itBy Michael Burke

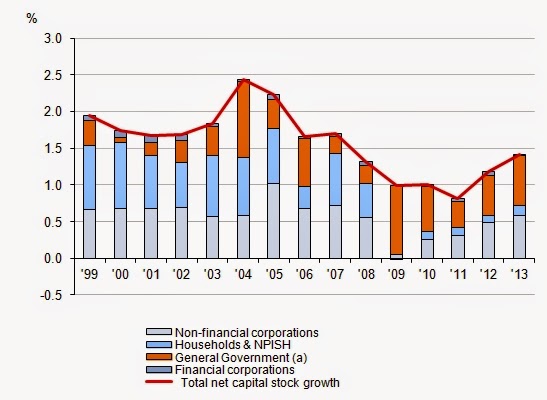
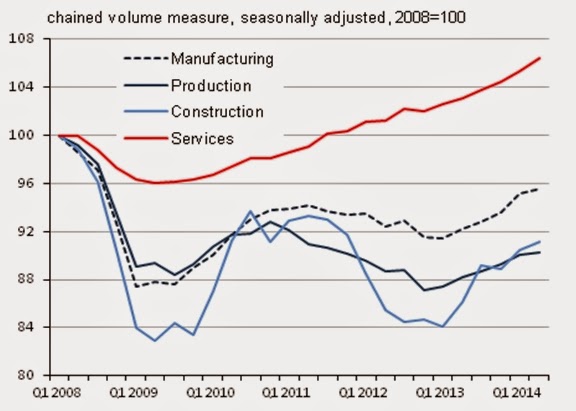
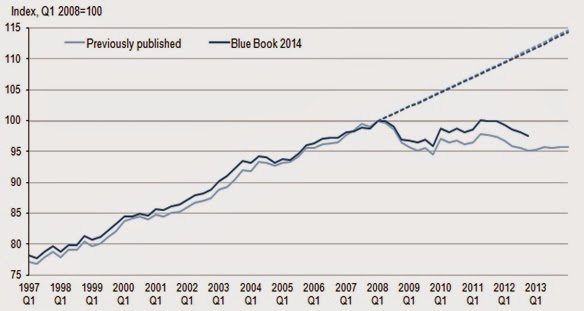
The French economy is in a grave crisis, much worse even than the sluggish growth of the OECD countries and almost as bad as Britain. In the 6 years since the beginning of the crisis the OECD economy as a whole has grown by just 4.5%. Over the same period the French economy has grown by just 1.2%. This is closer to the British economy, which was still 0.6% lower than when the recession began. The data is shown in Fig. 1 below.

Fig.1 Real GDP in OECD, Britain and France, Q1 2008 to Q1 2014
Source: OECD

Supporters of the Tory government’s austerity policy have bizarrely attempted to congratulate themselves on the recovery in Britain as the following quarter finally saw the British economy exceed is previous peak. But 0.2% growth in over 6 years is the worst performance since the Great Depression.

Similarly, there is an absurd attempt to portray the situation positively in Britain because it is better than the crisis in France. This is both factually incorrect (in the 2nd quarter of 2014 the French economy was 1.2% above its pre-recession peak) and meaningless. However bad the sitation in France, this would make no-one in Britain better off.

Investment Strike

In reality, the cause of the crisis in France has the same source as the crisis in the OECD as a whole and in the British economy. It is the fall in productive investment (Gross Fixed Capital Formation) which accounts for both the severity of the initial recession and the prolonged character of the following stagnation.

The various trajectories of each economy have also been determined primarily by the chages in investment (GFCF). Initially the crisis in France was much less severe than the in the OECD as a whole because the fall in investment was less sharp. By contrast, investment fell further in Britain and the recession was sharper than in either France or the OECD. However, the recovery in French investment stalled in mid-2012 almost immediately after Hollande won the Presidential eelction and began to apply austerity policies.

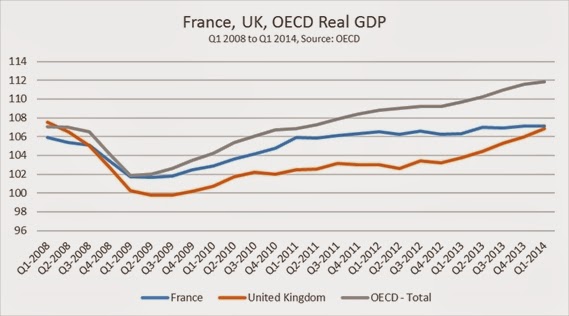
By contrast, OECD investment has been painfully slow to recover. But it has been on an upward trend since the 3rd quarter of 2009, which accounts for the steady crawl out of recession. In Britain the ludicrous zig-zags of government austerity policy killed off a weak recovery in 2010. But large government subsidies to reflate a housing bubble have had the effect of increasing consumption and house building from its all-time low from the end of 2012. These trends are show in Fig. 2 below.

Fig.2 Real GFCF in OECD, France, UK, Q1 2008 to Q2 2014
Source: OECD

The French Crisis

There are two key indicators of the role of the slump in investment as the cause of economic crisis in France. These are the performance of investment relative to other components of the national accounts and investment relative to its previous trend.

Investment in France began falling once more when the Hollande government began implementing austerity policies. Prior to that point, the right-wing Sarkozy administration had talked about the need for austerity, but was generally keeping these measures in reserve in the hope of getting re-elected (similar to the Tory government from mid-2012 onwards, with a similar lack of success likely).

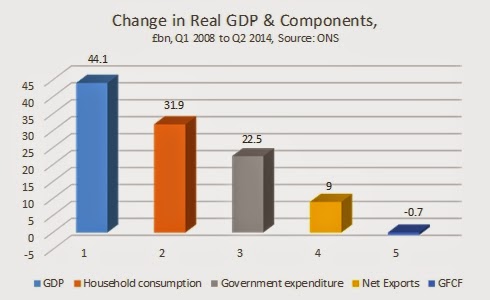
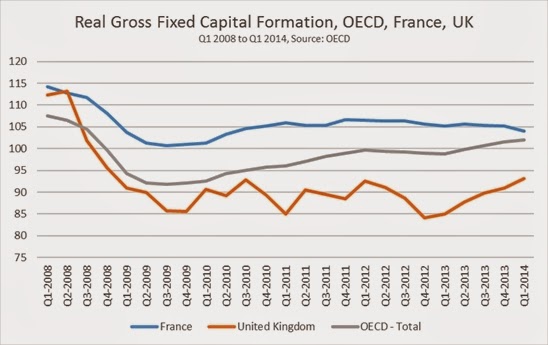
Fig.3 below shows the real performance of France’s GDP and its components from the beginning of the crisis to the 2nd quarter of 2014. In aggregate GDP is almost €21bn higher than it was in the 1st quarter of 2008. Investment (GFCF) is the only component of GDP which remains significantly below its pre-crisis level. Consumption by both the private sector and of government is higher. The problem of the French economy is not primarily a crisis of ‘aggregate demand’. It is investment, not consumption which is the brake on a genuine recovery.

Private consumption is over €31bn higher and government consumption is strongest of all at over €44bn higher. This also belies the idea that austerity is aimed at reducing government spending. Pro-business parties are far less concerned about increasing government spending if this is directed towards consumption. They are opposed to an increase in government investment, which interferes with the dominant role of the private sector in the ownership of the means of production. Despite much talk about the ‘bloated state sector’ in France government investment is actually a smaller proportion of the total than in the Anglo-Saxon countries of the US and UK (just 15.3% of the total in the most recent 2011 data).

Investment is now €37.5bn lower than its pre-crisis peak. It has fallen from 20.4% of GDP to 18.2%. Only net exports are also negative, but the decline is much less significant with a fall of just €2.6bn. The performance of real GDP and its components is shown below.

Fig. 3 France Real GDP & Components, Q1 2008 to Q2 2014
Source: OECD

The trend decline in investment is equally stark. Investment has fallen by 9.9% in a little over 6 years since the crisis began. In the comparable period prior to the crisis investment had expanded by 18.9%. If this prior trend growth rate of investment had been maintained, it would now be €109bn higher. This would directly add 6% to GDP even before any productivity effects from higher investment are taken into account. GDP and the investment trend are shown in the Fig. 4 below.

Fig.4 Real GDP & GFCF Trend, Q3 2000 to Q2 2014
Source: OECD

The resources for investment

If there were no idle resources in the economy it would be necessary to constrain consumption in order to finance investment. But that is not the case currently. In common with most OECD economies (including Britain) the profits of French firms have been recovering.

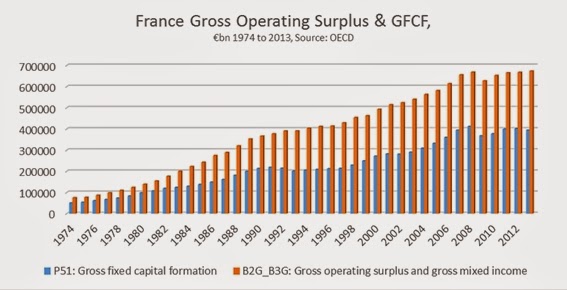
In nominal terms the profit level (Gross Operating Surplus) peaked at €668bn in 2008. But after a slump in 2009 profits have turned slowly higher and finally recovered (in nominal terms, not taking account of inflation) to €674bn in 2013. But investment has continued to fall and is now €17bn lower than in 2008. The investment ratio (investment as a proportion of profits) has therefore declined.

This is the culmination of a long-term trend. Fig.5 below shows the nominal level of profits and the investment for the French economy over the last 40 years. At the beginning of the period the investment ratio was approximately two-thirds. In 2013 investment was €395bn compared to profits of €674bn, an investment ratio of just 58.6%. Simply restoring the former investment ratio would increase the level of investment by approximately €40bn. Instead, the level of uninvested profits continues to grow.

Fig.5 France Profits & Investment, 1974 to 2013, €bn
Source: OECD

France is not in crisis because of the Euro. The main features of the crisis are the same as in Britain, which maintains its own currency. Nor is it true that the crisis of the French economy is caused by a bloated state sector. On the contrary, government investment as a proportion of total investment is now lower in France than in either the US or UK.

This is actually a key part of the problem. The crisis is accounted for by the fall in investment. The private sector is on an investment strike. This is exacerbated by the cuts in the government’s own level of investment.
The resources exist to resolve the crisis throught state-led investment. This can be funded by using uninvested profits of the private sector. A certain proportion of this can be done indirectly via government borrowing, especially as borrowing costs for 10 years are just 1.25%. It can also be done directly, directing the state-owned enterprises and the the commercial banks to increase investment, as well as other measures.