Uncategorized

How Labour can transform the economy under Corbyn – The economic impact of increased investment

By Tom O’Leary

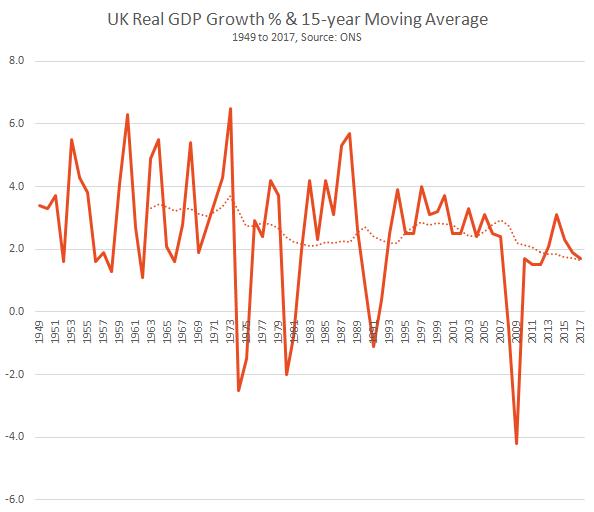
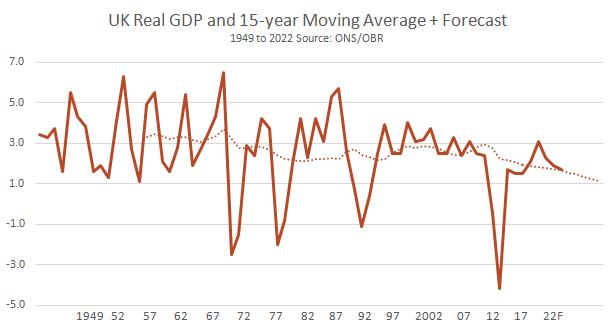
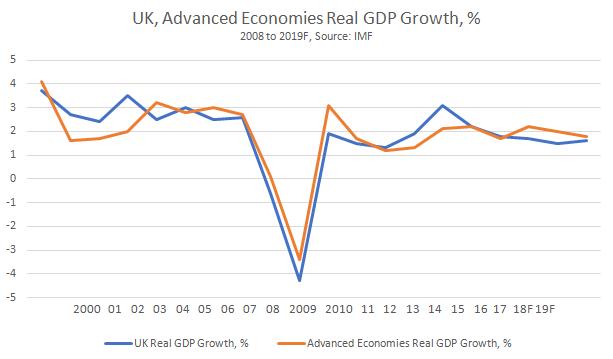
The UK economy remains mired in stagnation caused by the crisis of investment. The official forecasts for UK growth point to the weakest expansion in the economy in the modern era, since 1945.

The economic policy of the Labour Party under Jeremy Corbyn and John McDonnell is to increase public investment as a way out of the crisis, which is entirely correct. In addition, there will be increased spending on public services, the NHS, education and so on, financed by increasing taxes on big businesses and the rich. This amounts to reversing the tax give-aways under the Tory policy of austerity, which was fundamentally a transfer of incomes from workers and the poor to big business and the rich and is also entirely appropriate.

The purpose of this piece is to examine the economic impact that increased investment, using the latest developments in statistical analysis of the medium-term determinants of growth.

Accounting for growth

As there is widespread confusion on this matter, it is important first to establish what are the factors that determine economic growth. It is widely and incorrectly asserted that these are variously, increasing ‘demand’, increasing the supply of money, increasing Consumption, improved innovation, or rising ‘entrepreneurial activity’. None of these assertions is correct.

The world’s leading expert on productivity growth is Dale Jorgenson. The methodology he and his colleagues have expounded and elaborated in several works has been adopted in growth accounting by the OECD, among others. In ‘Productivity and the World Economy’ (pdf) he writes,

“The contributions of capital and labor inputs have emerged as the predominant sources of economic growth in both advanced and emerging economies. Economic growth depends primarily on investments in human and non-human capital, including investments in both tangible and intangible assets”.

Using the analysis outlined in his work it is possible to identify the impact of ‘investment in human and non-human capital.’

Jorgenson’s research shows that it is the amount of capital and the amount of labour, as well as their quality, that are the decisive factors in growth. This statistical analysis refutes all efforts to portray growth as ‘demand-led’, or ‘aggregate demand-led’, or a function of innovation, or entrepreneurial activity, or other myths.

In Jorgenson’s new book, ‘The World Economy’ (with Fukao and Timmer) he argues that one of its major findings is that, “replication rather than innovation is the major source of growth in the world economy. Replication takes place by adding identical production units with no change in technology. Labor input grows through the addition of new members of the labor force with the same education and experience. Capital input expands by providing new production units with the same collection of plant and equipment. Output expands in proportion with no change in productivity.”

The empirical proof of this analysis can be found through economic history up to and including the current crisis. In 2007 and 2008 the US and then all the leading capitalist economies did not suddenly experience a downturn in demand, or Consumption, or money supply growth, firms did not stop innovating and ‘entrepreneurs’ did not stop trying to make profits.

It should also be added that, among the real factors accounting for growth, the labour force did not stop growing (on the contrary, unemployment surged in many countries) and the education systems did not suddenly deteriorate.

In reality the 2007-2008 recession was caused by a slump in private sector investment and the continued stagnation of the leading economies is a function of the continued weakness of private sector investment. This is illustrated in Chart 1 below.

Chart1. G7 Gross Fixed Capital Formation & Private Consumption Growth 2004 to 2017

As Chart 1 shows, there was no crisis of Consumption until well after the Investment slump had already begun. By mid-2007 Investment growth in the G7 had slowed to a crawl and begun to contract a few months later. At that time Consumption continued to grow at its previous pace and did not begin to contract until the second half of 2008. Widespread measures to stimulate Consumption coming out of the crisis have only had a limited effect, largely leading to an increase in household indebtedness. Investment growth has never properly recovered and it is this that accounts for the continued stagnation in the G7 economies.

Accounting for investment

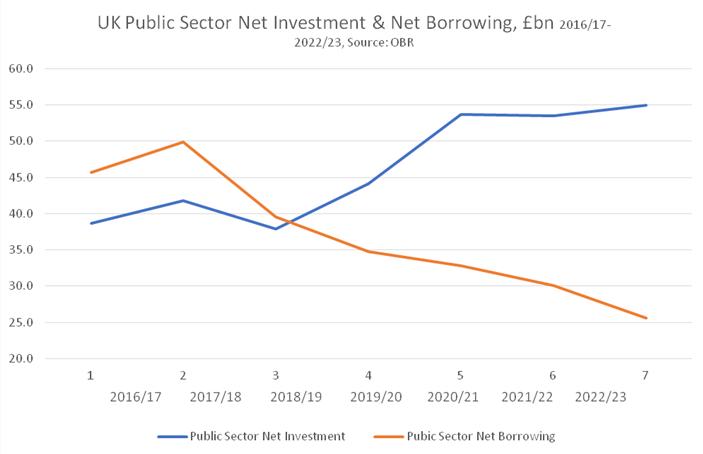
Just as in the G7 as a whole, the UK recession was caused by a slump in private sector investment as shown in Chart2 below.

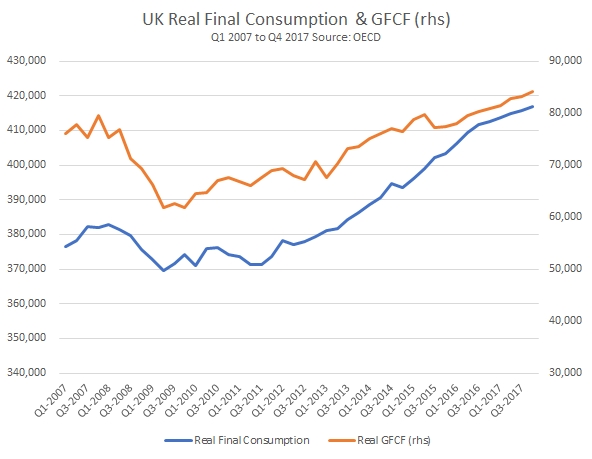
Despite the fact that Investment is a far smaller component of UK GDP than Consumption, the contraction in Gross Fixed Capital Formation (GFCF) was far greater than the decline in Final Consumption. From the pre-recession peak to the trough at the low-point of the recession Consumption fell by £54.8 billion, while Investment fell by £70.4 billion.

Likewise, although Consumption growth has been exceptionally weak it now stands £136.8 billion above is pre-recession peak, while Investment is just £18.4bn above is pre-recession. Consequently the proportion of the economy directed towards Investment has decline from the pre-recession peak of 17.9% to 17.1% of GDP at the end of 2017. It is this that accounts for the weakness of growth overall and therefore the weakness of the growth in Consumption. This corresponds to the Jorgenson analysis.

From this analysis it follows that the Labour policy of increasing Investment is entirely correct. Furthermore, the policy of only borrowing to increase Investment is also correct. Only Investment to increase the productive capacity of the economy (the increase in the ‘means of production’) can sustainably increase the level of production of that economy.

But what is the likely return on that Investment? Or, put another way, what should be the level of Investment in order to achieve specific policy objectives of increased growth in output?

Here the Jorgenson analysis is indispensable. Its results are available from the Conference Board, which uses the same methods and data.

In the Conference Board Total Economy Database (adjusted version) May 2017, the contributions to UK GDP growth over the medium-term of capital inputs, labour inputs and Total Factor Productivity are shown as follows: Capital 0.9%, Labour 0.7% and TFP 0.2%. UK GDP itself grows by an average of 1.8% per annum over the medium-term (1990 to 2016), the aggregate of those inputs.

Chart3. Contributions to UK GDP Growth, per cent, 1990 to 2016
Source: The Conference Board Total Economy Database (adjusted version) May 2017

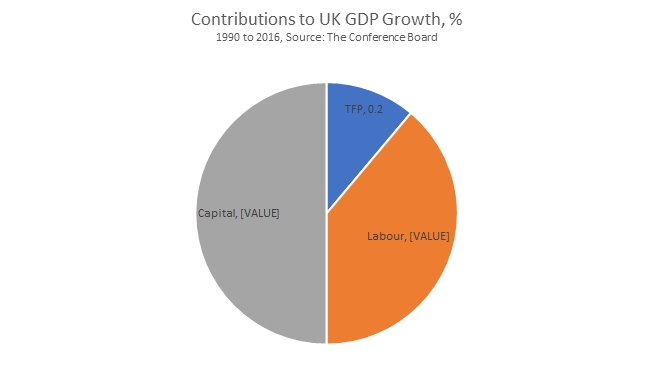
Within the category of Labour inputs the contribution of labour quality is a negative, at 0.1% and the total contribution of Labour inputs is entirely a function of the growth on the quantity of labour, +0.8%. Labour quantity can be increased either by increasing the productive workforce or by the existing workforce working longer hours, or some combination of the two. But in either event, the scope for increasing per capita living standards without increasing hours is almost wholly dependent on increases in Capital inputs.

Therefore, any sustainable increase in output per hour worked is overwhelmingly determined by the growth in capital inputs. The Corbyn-McDonnell focus on investment is therefore entirely correct, based on the most sophisticated mainstream economic analysis. (An entirely separate set of policies are needed to address the decline in labour quality inputs identified above, but that is not the subject of this piece).

The return on investment

The Conference Board data also allows an analysis of the return on capital investment which is the addition to the productive capacity of the economy, or the increase in the means of production.

The Incremental Capital-Output Ratio (ICOR) measures the ratio between increased Capital deployed and the resulting change in the annual level of output over the medium-term. From this it is possible to identify two effects. First, it is possible to identify the likely return on a given level of investment (if the ICOR remains unchanged). Secondly, it is possible to identify the required level of investment to achieve a specific level of increased output (again, if the ICOR remains unchanged).

At 2016, the Conference Board 5-year moving average for the UK ICOR is 8.0. This means that an increase in annual output over the medium-term of £1 billion requires an increase in investment of £8 billion. The same ratio applies if the numerator is changed. So, an annual increase in output over the medium-term equivalent to 1% of GDP requires an increase in investment of 8% of GDP.

In the Conference Board Total Economy Database the UK ICOR was not always so high. Prior to the recession that began in 2008, the ICOR fluctuated around 6.0. This would reduce the level of investment required to achieve a given level of increased output, or would increase the level of output arising from a given increase in investment. But it remains to be seen whether there has been a permanent or at least enduring deterioration in the ratio or whether this is a hangover from the slump.

In any event, using the ICOR identified from the Conference Board Database, it is possible to examine the effects of Labour’s commitment to increased public sector investment.

Increased public sector investment

Labour’s economic policy is to borrow only for increased public sector investment. The consequent growth can allow for further increases in investment or increased public spending on services, or some combination of the two.

From the analysis above it is possible to identify the impact of planned investment. Each increase in public sector investment of £8 billion increases the medium-term level of output by £1 billion. Labour’s plan is to increase public sector investment by £25 billion each year compared to current levels. This would directly increase medium-term output by a little over £3 billion each year. There may be indirect or induced positive effects on increasing private sector investment, but these cannot be known or certain in advance.

Over the lifetime of a 5-year parliament the cumulative effect of this increased Investment would be £125 billion. Applying the ICOR ratio of 8.0, this would increase medium-term output by just over £15.6 billion. By using the current level of nominal GDP of a little over £2 trillion (or £2,000 billion), the net effect of Labour’s plans would be to increase GDP over the medium-term by the equivalent of almost 0.8% of GDP.

However, on a reasonable assumption of continued economic growth and therefore expansion in GDP, over the medium term the cumulative effects of investment would be slightly reduced, as GDP will have expanded. So, the effect would be closer to an increase of 0.75% in GDP over a five year period, or 0.15% per annum for the lifetime of the parliament. Using the same ratios, if the policy aim was to achieve a 0.25% increase in GDP per annum this would require the level of planned Investment to rise to £40 billion per annum.

There are two further points worth emphasizing. Up to this point, the subject for discussion has been the medium-term consequences of increased Investment on raising the level of GDP. But the actual expenditure on investment also raises output in the short-run, in the year or years that the Investment is made. The first point is that the immediate effect of increasing public sector investment by £25 billion each year will itself increase GDP by 1.25% each year, in the very short-run. The effect of Labour’s policy will undoubtedly be an important boost to the economy and therefore to living standards.

The second point is that Labour’s economic inheritance will be extremely poor, even on official forecasts. Therefore it may be necessary, within the limits of what is realistically possible to borrow, to increase the planned level of increased public sector investment, simply to stave off a deteriorating economic situation. In that case, further measures may be necessary, not just increased borrowing but also measures to direct investment through existing public sector bodies, the new National Investment Bank and in the private sector itself.

Trump’s tariffs against China are bad news for US farmers, companies and workers!

Trump’s tariffs against China are bad news for US farmers, companies and workers!By John Ross

In drawing up its list of tariffs on $50 billion of Chinese products the Trump administration carefully tried to avoid one of the chief bad effects these tariffs will have on the US population by excluding many consumer goods from the list. This was clear proof the administration feared the hostile reaction from US consumers as prices went up on these imported goods in US shops. But by concentrating on trying to lessen the impact on US consumers the Trump administration has necessarily increased the negative effects on US jobs and particularly US manufacturers and farmers.

This has meant it has not really concealed the negative effects on the US economy at all. Therefore, within hours of the US announcement, and even before China’s firm response, even Western commentators were accurately pointing out the main groups within the US itself that would be hit by the tariffs.

It is important to understand not only the impact on China of the Trump proposed tariffs but also the impact in the US. It is therefore worth looking at accurate Western studies of this.

Impact on US manufacturers

David Fickling, writing in Bloomberg, noted the effect of the US tariffs may remove as much as half of the benefit which the Trump administration recently gave to US manufacturing companies via tax cuts. Bloomberg’s headline was clear: ‘Trump Tariffs Stick It to U.S. Manufacturers. Firms might as well give back half of that $26 billion-a-year tax cut they just got.’

Fickling entirely accurately analysed the attempted concealment of the impact of the US actions on the US economy and population: ‘the list [of US tariffs] appears to have been chosen with care. Officials started with all products felt to benefit from Chinese industrial policies, before removing those that were “likely to cause disruptions to the U.S. economy,” those that would hit consumers’ pockets hardest, and those that couldn’t have levies for legal or administrative reasons.

‘The protection of individuals’ wallets is probably the most important part of that… China has a substantial advantage in this trade war in that the majority of its biggest exports to the U.S. are consumer goods whose purchasers tend to be price-sensitive voters. Trade in the opposite direction focuses far more on intermediate products bought by Chinese companies expected to do their bit for Beijing. By sparing consumers, Lighthizer is sending a strong signal he won’t let this fight be lost because of discontent on the home front.

‘That’s why, while hundreds of product lines under tariff code 85 (electrical machinery and equipment and parts thereof) will be subject to a 25 percent impost, subsection 8517 — mobile phones, which constitute about 40 percent of U.S. imports from China for that category — won’t suffer a cent.’

But by exempting many consumer goods, while simultaneously aiming to meet the $50 billion target for sectors hit by tariffs the Trump administration had wanted, the US has been forced to affect a much wider range of non-consumer goods. Again, as the Bloomberg article correctly noted, it is a: ‘fact that the plan will most likely hurt the parts of the economy it purports to help. Another way of looking at the $12.5 billion that will be levied is that it’s essentially the government taking back about half of that roughly $26 billion-a-year tax cut it just delivered to manufacturers.

‘Once you consider the ways domestic suppliers could raise prices in response to the reduced competition from China (as is already happening with steel and aluminum), the cost to end-product manufacturers will probably be higher. Producer prices in the sector are already rising at the fastest pace in almost six years; the squeeze to profits should intensify before it eases.

‘The second point is related. The list at present isn’t written in stone — instead it will be put out to industry consultation for 60 days. That gives manufacturers ample time to make their complaints to Washington, and to get their carve-outs in return. The Trump administration isn’t famed for its resistance to such influence: 195 of the executive branch’s 2,684 appointees are former lobbyists, according to a database by journalism nonprofit ProPublica.

‘Such pushback will probably be to the benefit of a U.S. economy that was doing perfectly well before the current skirmish came along. But it will weaken Washington’s hand in the months ahead. The National Association of Manufacturers is already calling for a trade agreement, rather than the current path toward a conflict.’

Fickling’s overall conclusion was entirely accurate: ‘President Donald Trump must now choose whether his main objective is helping American manufacturers, or sticking it to the Chinese. He can’t have both.’

US farmers protest

In addition to the impact on US manufacturers the Financial Times particularly noted the effect of the US farm sector and the reactions from it: ‘Max Baucus, a former senator from Montana and US ambassador to China who now serves as the co-chairman of the lobby group Farmers for Free Trade, said farmers were being “squeezed from all sides” by the Trump administration’s attack on China.

‘“First, the tariffs the US announced today will make the [agricultural] equipment and inputs they rely on more expensive. Then they will face new tariffs on their exports when China retaliates,” Mr Baucus said. “American farmers are watching this daily trade escalation closely, and they are worried.”

‘US business groups have called for the Trump administration to rethink its plan for tariffs, arguing that while they shared its concerns about China’s intellectual property regime the White House plan amounted to new taxes on US consumers and businesses… “imposing taxes on products used daily by American consumers and job creators is not the way to achieve those ends,” said Myron Brilliant, the head of international affairs at the US Chamber of Commerce.’

The action China has now announced on US soybeans exports will of course tighten that squeeze on US farmers. The Financial Times noted: ‘John Heisdorffer, president of the American Soybean Association, warned that the Chinese tariff would “have a devastating effect on every soybean farmer in America”. He urged Mr Trump to “engage the Chinese in a constructive manner, not a punitive one”.’

The strategic target of the US tariffs

Bloomberg also analysed that the clear aim of the tariffs was to attempt to block China’s advance into more technologically advanced production. It noted “The tariffs may have only a minor economic impact, increasing levies by $12.5 billion on Chinese shipments to the U.S. that reached $506 billion last year, said Shane Oliver, the head of investment strategy at AMP Capital Investors Ltd. in Sydney. That’s an average tariff increase on overall imports from China of just 2.5 percent, he said.” But: ‘In targeting sectors that Beijing is openly trying to promote, the U.S. is signaling that its strategic aim in the current conflict is preventing China from gaining the global technological leadership that it wants.”’

But in attempting to block China’s rise the Trump administration has launched an attack not only on China but on US companies, workers and farmers. The outcome of the situation will be decided by the interaction of both fronts in this battle.

The above article was previously published here on Learning from China.

The worst outlook in the modern era

The worst outlook in the modern eraBy Tom O’Leary

The economic outlook for the UK is the worst it has been in the modern era, the entire post-World War II period. This is not the verdict of some rabidly anti-Tory propaganda. It is based on the UK Treasury’s own forecasts for GDP.

The Treasury’s forecasts for real GDP from 2018 to 2022 are reproduced below, from the Chancellor’s Spring Statement. The average annual GDP growth is forecast to be just 1.4% over the period, and growth will never exceed 1.5%. This compares to 1.7% growth in 2017, which was itself significantly below the long-term average growth rate and the weakest since 2012. According to official forecasts, the best of this recovery is already behind us.

Chart 1. UK Treasury Real GDP Growth Forecasts, 2018 to 2022
Source: UK Treasury/OBR

Over the medium-term, this will be the slowest growth rate of any period in the modern era. Chart 2 below shows the growth rate of UK real GDP from 1949 to 2017, plus the 15-year moving average. Using a 15-year moving average has the effect of removing the short-term fluctuations of the business cycle. To date the slowest growth rate on this measure of the 15-year moving average is the current one. The average growth rate over the 15 years to 2017 is just 1.7%.

Chart 2. UK Real GDP Growth and 15year Moving Average
 

However, if the Treasury’s forecasts for the next 5 years are included then the 15-year moving average real GDP growth falls to 1.2% by 2022. This is significantly below anything that has been experienced in the modern era. This is shown in Chart 3 below.

Chart 3. UK Real GDP Growth and 15year Moving Average + Forecast to 2022
 

1.2% average annual growth is exceptionally low. It is half of what had often previously been cited as the trend growth rate of the UK economy of 2.5%. If these forecasts are approximately accurate, they will have severe negative consequences for living standards and for public finances and public services for many years to come. 

The ‘political centre ground’ will also continue to erode as radical economic and social policies will be sought. The next SEB piece will address the appropriate perspective for ending economic stagnation.

Navigating a way out of the crisis

.534ZNavigating a way out of the crisisBy Tom O’Leary

The UK economy is in such a parlous state that the Bank of England is threatening to raise interest rates even though last year’s GDP growth rate was a feeble 1.8% and real wages continue to decline. This is a striking effect of the dearth of investment since the Great Recession.

The Bank’s Governor Mark Carney is concerned about capacity constraints in the economy leading to inflation. This lack of capacity, the weak growth in the means of production, arises because there has been a woeful lack of productive investment from before the recession began in 2008.

The UK economy is actually receiving a lift from the upturn in the world economy, particularly in Europe, but its relative position is declining. In effect, as the world economy is expected to see its best growth rate since 2010, the UK economy is expected to see its worst growth rate since that time.

In the three years from 2017 to 2019, the latest projections from the IMF are that the world economy will accelerate to an average of just over 3.8% real GDP growth. At the same time the UK economy will decelerate to less than half that growth rate, to just under 1.6%. By contrast, the advanced economies as a whole are expected to accelerate to just under 2.3%. The IMF expects that the main driver of world growth will come from what it describes as ‘Emerging market and developing economies’ at just under 4.9% growth, led by India and China.

The IMF has no crystal ball, and frequently makes incorrect forecasts. But the divergence in growth expectations for the UK economy compared with most of the rest of the world is striking. The UK is also one of only two economies it highlights where the IMF has downgraded its growth expectations.

The UK economy is already in poor shape. The advanced economies have been crawling along in growth terms since the crisis began. Using IMF projections for the next two years, these advanced economies will have grown cumulatively by just 17.1% over 12 years. But the UK economy will have grown even more slowly, by just 14.3%. The relative growth rates for the UK and for the advanced economies as a whole are shown in Chart 1 below.

Chart 1. UK, Advanced Economies Real GDP Growth, 2000 to 2019 (Forecast)
 

Austerity and the deficit

Even the UK’s sub-standard growth rate does not provide an accurate picture of the bleak outlook for living standards. In addition to the sharp deterioration in public services and social welfare provisions, the labour share of national income has fallen sharply since the imposition of austerity in 2010, as shown in Chart 2 below.

Chart 2. UK Labour and Profit Share of National Income, %, 1997 to 2016
 

Austerity can be seen as an attempt to drive up the profit share from its low-point of 17.1% in mid-2009, just after the crisis began. The prolonged effort has only been partially successful, as the profit share has increased from its low-point, yet it remains far below its pre-crisis highs at the turn of this century.

But the labour share (in an economy that is barely crawling along) has not recovered from its end-2009 peak. Mathematically, the labour share is an independent variable, not determined by the growth rate of GDP and instead determined by the struggle between workers and bosses over wages, pensions and other entitlements. In reality, the struggle for higher or even constant wages is exceptionally difficult when the economy is not expanding more rapidly.

Real wages are now 3% below their peak level in March 2008, as shown in Chart 3. Nominal wages rose 19.5% over the same period, but the two currency devaluations of the pound, one arising from the recession and the other following the Brexit vote, have more than eroded that rise in cash terms via inflation.

Chart 3. UK Real and Nominal Wages

Higher wages, just like improved public services and social provisions are much easier to achieve with higher economic growth. But the widespread expectation is that UK growth will be slowing over the next period. This has negative consequences for living standards in the broadest sense, including real pay, social welfare and public services. The consequence for government finances will also be worse, as tax revenue growth will be curbed and outlays related to poverty and under-employment will be higher.

Therefore, in order to address the crisis in living standards and wages, and to tackle the glaring problems in areas such as housing, the NHS, social security, public sector pay and so on, radical measures will be required at a time when government finances are once more under pressure. 

Even if Carney is proved wrong in his forecasts of the Bank’s own actions, his pronouncements show that the UK economy could become locked in low growth over the very long-term, with every modest upturn met with higher interest rates to choke off the threat of inflation. To be clear, in mainstream economic policy making all types of inflation are allowed, house prices, stocks and bonds, even Bitcoin. But wage inflation is not permissible and it is this ‘threat’ the Bank of England is poised to prevent.

Navigating a way out of the crisis

Since the recession a number of measures have been adopted which have been designed to boost the economy by raising demand (‘Help to Buy’) or by creating money (‘Quantitative Easing’). By themselves, they are unable to sustainably raise the growth rate of an economy which remains in crisis because of weak investment.

The UK economy is experiencing a productivity crisis, which is not a ‘puzzle’ or ‘mystery’ as is widely claimed, but is instead a function of its low rate of investment. The advanced industrialised countries as a whole are also experiencing a productivity crisis, and the UK is simply among the worst because its level of investment is among the worst.

Productivity matters, because without increasing productivity any rise in living standards is dependent on working harder, or longer hours, or labour trying to claim a greater share of national income from capital.

The world’s leading expert on productivity growth is Dale Jorgenson. In ‘Productivity and the World Economy’ (pdf) he writes,

“The contributions of capital and labor inputs have emerged as the predominant sources of economic growth in both advanced and emerging economies. Economic growth depends primarily on investments in human and non-human capital, including investments in both tangible and intangible assets”.

Using the analysis outlined in his work it is possible to identify the impact of ‘investment in human and non-human capital.’

Jorgenson’s research shows that it is the amount of capital and the amount of labour, as well as their quality, that are the decisive factors in growth. This statistical analysis refutes all efforts to portray growth as ‘demand-led’, or ‘aggregate demand-led’, or a function of innovation, or entrepreneurial activity, or other myths.

In Jorgenson’s new book, ‘The World Economy’ (edited with Fukao and Timmer) he argues that one of its major findings is that, “replication rather than innovation is the major source of growth in the world economy. Replication takes place by adding identical production units with no change in technology. Labor input grows through the addition of new members of the labor force with the same education and experience. Capital input expands by providing new production units with the same collection of plant and equipment. Output expands in proportion with no change in productivity.”

Jorgenson also analyses the historical impact of changes in these inputs for total growth in a variety of economies, including lesser economies like the UK. Using these analytical tools, it is possible to outline a projection of growth for the UK economy based on increasing those inputs, capital and labour, in line with the Labour Party’s intention to end austerity and reverse it. In a follow-up piece, that outline will be presented.

New turbulence on US financial markets shows the limits on US growth under Trump

By John Ross

On Friday 2 February sharp turmoil, which had been building for some time, shook US financial markets.

  • The driving force was the continuing sharp rise in US Treasury Bond yields, that it the interest rate on US Treasuries, which has risen from 1.86% when Trump was elected to 2.84%.  US Treasury rates set the floor for all long term US interest rates and are far more important for US economic trends than the shifts in Federal Reserve interest rates.
  • Simultaneously US jobs data was released showing that wages in January had risen by 2.9% compared to a year earlier – seen as an indicator of inflationary pressure in the US.
  • Meanwhile commodity prices, as measured by the S&P GSCI index had risen by 10.6% compared to a year earlier – adding to inflationary pressures in the US.
  • This helped precipitate a 2.1% fall on 2 February on the S&P500 – the most severe daily decline since Trump was elected.

In summary the US economy was showing clear signs of rising interest rates and rising inflation – producing the market turmoil.

It is important to understand that these trends are not separate. They show that although US economic growth is low by historical standards, with only a  2.5% year on year GDP increase in the year to the 4th quarter of 2017, it is showing signs of overheating:

  • Interest rates are the price of capital, and the sharp rise in interest rates shows that the supply of capital in the US is smaller than the demand for it,
  • Inflation shows that supply of goods and services, including labour, is smaller than the demand for it.

In summary, despite low growth, the US is showing signs of capacity constraints.

By coincidence on the morning of the same day an article by me analysing the latest US economic data was published. This clearly predicted these trends – although it was of course written before the events on 2 February. This article is published without change below except for an updating of the US bond yields data to the end of 2 February. ​

*   *   *

The new release of US and EU GDP data for the whole of 2017 allows a factual examination of the latest state of the US economy and constitutes a baseline for assessing the future impact of the Trump tax cuts. This new data confirms the following fundamental features of US economic performance.

  • In 2017, for the second year in a row, the US was the slowest growing of the major economic centres – behind not only China but also the EU.
  • In the last quarter of 2017 the US continued to undergo a purely normal business cycle upturn from its extremely bad performance in 2016
  • There was no sign of an improvement in the fundamental economic structure of the US economy that would permit significantly accelerated growth in the medium/long-term.
  • Therefore, the perspective is that the US will undergo a cyclical upturn in 2018 before encountering capacity constraints that will again slow its economy in 2019-2020 – the symptoms of these capacity constrains are likely to be increasing interest rates and rising inflation.

This situation of the US economy has significant implications for US-China relations. In particular, as the US is unable to speed up its medium/long term growth, those forces in the US seeking to engage in ‘zero-sum game’ competition with China can only achieve their goal of improving the position of the US relative to China by trying to slow China’s economy.

These implications will be considered in the conclusion of the article. However, first, using the approach of ‘seek truth from facts’ the latest data on the US economy will be examined.

US was again the most slowly growing major economic centre​

The new data shows that for the second year in succession the US was the world’s most slowly growing major economic centre – see Figure 1:

  • In 2016 US economic growth was 1.5%, EU growth 2.0%, and China’s growth 6.7%
  • In 2017 US economic growth was 2.3%, EU growth 2.5% and China’s growth 6.9%

This data shows that the claim in sections of the Chinese media that in the last two years the US was undergoing ‘dynamic growth’ was entirely false, the opposite of the truth. Bluntly it was in the category of ‘fake news’.

In addition to the data for the whole of 2017, in the year to the 4th quarter of 2017 the US was still the slowest growing major economic centre – US growth was 2.5%, EU growth 2.6%, and China’s growth 6.8%.

Although the facts of US poor economic performance in 2017 and 2016 are therefore clear this clearly poses a question. To what degree will the US improve this performance? This in turn requires examining both the position of the US in the present business cycle and the medium/long term determinants of the US economic performance.

Figure 1

Position of the US business cycle

In order to separate purely cyclical short-term movements from medium/long term fundamental trends in the US it should be noted that the medium/long term growth of the US economy is one of the world’s most predictable. Analysing the latest data, which go up to the 4th quarter of 2017, Table 1 shows that the three-year moving average of US annual GDP growth is 2.1%, the five-year moving average is 2.3%, the seven-year average is 2.1%, and the 20 year average is 2.2%. Only the 10-year moving average shows a significantly lower average – due to the great impact of the post-2007 ‘Great Recession’. Given that medium and long-term trends closely coincide the US fundamental medium/long term growth rate may therefore be taken as slightly above 2%.

Table 1

This consistent US medium/long term growth rate also makes it relatively easy to assess the short-term position of the US in the current business cycle. The key features of the latest data, for US economic performance in the final quarter of 2017, are given in Figure 2. This shows that US year on year economic growth in the last quarter of 2017 was 2.5%. This represents an upturn from the very depressed US growth during 2016 – which reached a low point of 1.2% growth in the 2nd quarter of 2016.

To accurately analyse this data, it should be noted that confusion is sometimes created in the media by the fact that the US and China present their quarterly GDP data in different ways. China emphasises the comparison of a quarter with the same period in the previous year. The US highlights the growth from one quarter to the next and annualises this rate. But the US method has the disadvantage that because quarters have different economic characteristics (due to the different number of working days due to holidays, weather effects etc) this method relies on the seasonal adjustment being accurate. But it is well known that the US seasonal adjustment is not accurate – it habitually produces low growth figures for the first quarter and correspondingly high figures in other quarters. It is therefore strongly preferable to use China’s method which, because it compares the same quarters in successive years, does not require any seasonal adjustment and therefore gives true year on year growth figures. All data in this article is therefore for this actual year on year growth.

In addition to showing 2.5% year on year growth for the latest quarter, Figure 2 shows that US annual average GDP growth was below its long-term average of 2.2% for six quarters from the 4th quarter of 2015 to the 1st quarter of 2017. Therefore, merely to maintain the US average growth rate of 2.2%, US growth would be expected to be above its 2.2% average growth rate for a significant period after the beginning of 2017. Figure 2 shows this is occurring, with US growth in the third quarter of 2017 being 2.3% and in the last quarter of 2017 reaching 2.5%. Therefore, the acceleration of US growth in the last quarter of 2017 was a normal business cycle development and did not reflect an acceleration in US medium/long- term growth.

More precisely, given the prolonged (6 quarters) period centring on 2016 when US growth was below its long-term average, this also means that purely for normal business cycle reasons it would be anticipated that for most of 2018 US GDP growth would be above its long-term average of 2.2%. This may allow US growth to overtake that of the EU, but not of course to overtake China. But there is as yet no indication that the US economy will achieve sustained growth of more than three percent growth rate claimed by Trump’s Treasury Secretary Cohn who stated to CNBC in justifying the tax cut that: ‘We think we can pay for the entire tax cut through growth over the cycle… Our plan was based on a 3 percent GDP growth. We think we can now be substantially above 3 percent GDP growth.’

It should be noted that Cohn’s claim is that three percent growth can be achieved over a business cycle – which would indeed be a substantial increase in US medium/long term growth. It is not at all the same as the US achieving three percent growth in a particular quarter or quarters – which has occurred previously and is entirely compatible with the maintenance of the current US medium/long term growth rate of just above 2.2%.

There is, of course, even less evidence that the US economy will achieve 6% growth as claimed by President Trump in his December press conference with Japanese prime minister Abe.

In order to asses the realistic growth rate for the US it is now necessary to analyse the fundamental determinants of US medium/long-term growth.

Figure 2


No basic acceleration in US long term growth

The most fundamental trend in US long term growth is the progressive slowing of the US economy which has been taking place for over 50 years. Figure 3 shows that, taking a 20-year moving average, to remove all short-term effects of business cycles, the US economy has progressively decelerated from 4.4% annual growth in 1969, to 4.1% in 1978, to 3.5% in 2002, to 2.2% in the 4th quarter of 2017. The fact that the US economy has been slowing for over 50 years shows that this process is determined by extremely powerful and long-term forces which will, therefore, be extremely difficult to reverse. The nature of these trends is analysed below – the latest US data, however, clearly shows no acceleration in long-term US growth which remains at 2.2%.

Figure 3


US medium-term growth

Turning from long-term to US medium-term growth, this necessarily shows greater fluctuations than US long term growth – as medium term growth rate is affected by business cycles. It is therefore useful, in analysing such cyclical fluctuations, to consider not only the average trend but also to make a comparison of successive peaks and troughs of business cycles. To illustrate these a five-year moving average for US growth is shown in Figure 4 and a three-year average is shown in Figure 5.

• Taking a five-year average, and considering the maximum growth rate in business cycles, the US economy slowed from 5.5% in 1968, to 5.0% in 1987, to 4.5% in 2000, to 3.0% in 2006, to 2.3% in the 4th quarter of 2017.
• Taking a three-year average, the US economy slowed from 5.9% in 1985, to 4.7% in 1999, to 3.7% in 2006, to 2.1% in the 4th quarter of 2017.

Therefore, the long-term tendency of the US economy to slow down is again clear. The trend of the peak growth rates in US business cycles falling over time is precisely in line with the long-term slowing of the US economy.

Figure 4

Figure 5

The chief factors in US medium/long term growth 

Having shown the factual trends in US economic growth it is then necessary analyse what produces them. My article ‘Trump’s Tax Cut – Short Term Gain, Long Term Pain for the US Economy‘ analysed in detail that statistically the strongest factor determining US medium/long term growth is US net fixed investment (i.e. US gross fixed capital formation minus capital depreciation). Table 2 updates the data regarding this given in the earlier article to now include 2017.

As may be seen, over the short-term there is no strong correlation between US GDP growth and the percentage of net fixed investment in US GDP – the R squared correlation for 1 year is only 0.21. Indeed, as ‘Trump’s Tax Cut – Short Term Gain, Long Term Pain for the US Economy’ showed in detail, there is no structural factor in the US economy which is strongly correlated with US growth in the purely short term. That is, put in other terms, numerous factors (position of the economy in the business cycle, trade, situation of the global economy, weather etc) determine short term US growth.

However, as medium and long-term periods are considered, the correlation of US GDP growth with the percentage of net fixed investment in US GDP becomes stronger and stronger. Already over a five-year period the level of net fixed investment in US GDP explains the majority of US GDP growth, and over an eight-year period the R squared  correlation is 0.71 – extremely strong.

It is unnecessary for present purposes to establish the direction of causality in this relation. The extremely strong correlation between US GDP growth and the percentage of net fixed investment in US GDP simply means that over the medium/long term it is not possible for the US economy to acclerate without the percentage of US net fixed investment in GDP increasing. This equally means that analysing the percentage of US net fixed investment in US GDP allows the potential for the US to accelerate its  medium/long term growth to be determined. This also means that to assess Trump’s possibility to increase US medium/long term growth it is necessary to analyse trends in US fixed investment.

Table 2

US net fixed investment

Turning to analysis of these factual trends, Figure 6 illustrates the percentage of net fixed investment in US GDP – showing the extremely sharp fall in this which has occurred. This fall corresponds to the long-term slowdown in US growth already analysed.

To be precise, taking peak levels in business cycles:

  • In 1966, in the middle of the long-post World War II boom, US net fixed investment was 11.3% of US GDP;
  • In 1978 US net fixed investment was 10.5% of US GDP;
  • In 1984 US net fixed investment was 9.2% of US GDP;
  • In 1999 US net fixed investment was 8.3% of US GDP;
  • In 2006 US net fixed investment was 7.9% of US GDP;
  • In the 4th quarter of 2017 US net fixed investment was 4.2% of US GDP.

It is therefore clear that while there has been some recovery of US net fixed investment since the extreme depth of the international financial crisis, US net fixed capital formation remains not only far below post war peak rates but even well below pre-international financial crisis levels. Due to this very strong medium/long term correlation between US net fixed investment and US GDP growth US economic growth cannot accelerate over the medium/long term without an increase if the percentage of US net fixed investment in GDP. Furthermore, it is clear that no such increase in the percentage of US fixed investment in GDP has taken place. Therefore, there is at present no basis for an acceleration in US medium/long term GDP growth.

Figure 6

Economic conclusions

In summary, the conclusions which follow from the latest US GDP data are clear:

  • Nothing has yet occurred which would indicate or permit an acceleration in medium/long term US growth from its present level of slightly above two percent.
  • The US is undergoing a normal cyclical recovery after its extremely poor performance of only 1.5% growth in 2016. Furthermore, in order to maintain the US long-term average growth rate, and counterbalance an extremely poor performance in 2016 and only slightly above average growth of 2.3% in 2017 as a whole, US GDP growth in 2018 would be expected to be above its long-term average – the effect of the Trump tax cut would be expected to sustain this short term increase. This trend however would not, unless the level of growth reached was extremely high, represent a break with the medium/long term slow growth of the US economy.

It is of course important to follow and check these trends factually given the importance of the US for the global economy and for China. Given the determinants of US economic performance over the medium/long term it follows that, in addition to factually registering US growth, it is necessary to regularly analyse the percentage of net fixed investment in US GDP in order to see if any new conditions for an acceleration of US medium-long term growth is occurring – so far it has not.

It should also be noted that the Trump tax cut, because it is not matched by government spending reductions, will sharply increase the US budget deficit and therefore, other things remaining equal, it will reduce US domestic savings, and therefore reduce the domestic US capacity to finance investment.

The following dynamic should therefore be anticipated in the US economy, which China’s policy needs to take into account:

  • In 2018 continued cyclical upturn in the US economy.
  • Due to the factors that would permit an upturn in US medium/long term growth not being present this cyclical upturn in 2018 will not turn into a much stronger upturn in 2019-2020 but on the contrary medium/long term factors slowing US growth may reduce growth from its likely 2018 level.
  • As the problem in the US economy is lack of net fixed investment, that is in expansion of the US capital stock, the  form of these factors slowing the US economy after its 2018 recovery are likely to be symptoms of capacity constraints and overheating – i.e. increases in US interest rates and in inflation. This upturn in US interest rates is already clear, with the yield (interest rate) on US 10-year Treasury Bonds rising significantly from 1.86% when Trump was elected to reach 2.84% on 2 February.

Figure 7

Geopolitical conclusions

Finally, while the focus of this article is economic, it is clear certain geopolitical conclusions flow from these factual trends in the US economy.

  • The inability of the US, with its present level of net fixed investment, to increase its medium/long term economic growth means that those in the US who advocate a ‘zero-sum game’ approach to US-China relations (‘neo-cons’ and ‘economic nationalists’) cannot achieve their goal of strengthening the position of the US compared to China by fundamentally accelerating the US economy. Their only practical policy option, therefore, is to attempt to slow China’s economy. This may possibly not be clear during 2018, when the US is undergoing a normal cyclical upturn, but it will become clear later as medium/long term US growth fails to accelerate.
  • The reduction in US domestic saving caused by the current tax cut means that US sources of financing fixed investment, other things remaining equal, will be reduced. This will increase pressures on the US to attempt to maintain its level of fixed investment through increased foreign borrowing – as in principle US fixed investment can be financed from foreign as well as domestic sources. However, as the US current account of the balance of payments is necessarily equal to US capital inflows with the sign reversed, this means that if the US undertakes increased foreign borrowing its balance of payments deficit will increase – which goes in the direct opposite direction to Trump’s pledge to reduce the US trade deficit.
  • If, however, the US does not engage in extra foreign borrowing then the reduction in US domestic saving which will result from the Trump tax cut would put downward pressure on US fixed investment – making it more difficult to achieve the US goal of increasing its medium/long term growth rate.
  • Therefore, given the US tax cut, the US is faced either with the choice of increasing foreign borrowing, which would go against President Trump’s pledge to reduce the US trade deficit, or to reject increased foreign borrowing – in which case, because of the reduction in US domestic savings due to the tax cut, downward pressure on US fixed investment would be created. This would, in turn, put downward pressure on US economic growth.

The consequences of this is that given the tax cut will be seen, after the normal cyclical recovery in 2018, not to achieve its goal of boosting US growth this is likely to lead to US neo-cons/economic nationalists falsely accusing other countries of creating the problems which have prevented US medium/long term growth accelerating. This may lead to such forces increasing their pressure for protectionist measures in the US.

*   *   *

This article was previously published on Learning from China and  originally published in Chinese at Sina Finance Opinion Leaders.

100 years on, women’s oppression is showing some old-fashioned characteristics

By Kerry Abel

2018 represents 100 years of women’s suffrage, with 6th February marking the hundredth anniversary of the Representation of the Peoples Act.

A rallying cry of the Suffragettes was Deeds Not Words. We have a government which pays lip service to women’s rights, their oppression and their representation. But these are only words.

A century on we should analyse the actual real situation women face and our achievements.

Equal pay

The struggle for equal pay for work of equal value is also a struggle against poverty. Those at the bottom of the pay scales at most workplaces are women. Even accounting for class and race differences women end up worse off – working class women are paid less than working class men; black women are paid less than black men; university educated women are paid less than university educated men and so on.

The UK median gender pay gap is currently 18.4% for all employees and 9.1% for full-time workers. Despite the 1970 Equal Pay Act making the practice of paying men and women differently for the same work unlawful, the biggest single piece of legislation to narrow the gender pay gap was the introduction of the National Minimum Wage (NMW) in 1997.

Parliamentary analysis shows the following:

“Research from the Low Pay Commission shows that the gender pay gap among the lowest paid fell from 12.9% when the NMW was introduced in 1998 to 5.5% in 2014. Analysis by the Fawcett Society in 2014 found that raising the NMW from £6.60 per hour to the Living Wage of £7.65 nationally, and £8.80 in London, would immediately reduce the gender pay gap by 0.8%. According to JRF, the cost of every part of the UK public sector becoming an accredited Living Wage employer, and including contracted out services within this, would be an estimated £1.3bn.”

Women benefit disproportionately from minimum wage laws precisely because they are disproportionately low-paid. It also highlights the virtual absence of mechanisms to enforce equal pay. Recent efforts by the government to encourage employers to address their gender pay problems are making a stuttering start. Gender pay reporting legislation requires employers with 250 or more employees to publish statutory calculations every year showing how large the pay gap is between their male and female employees. The website has been open for submissions for almost a year and so far, only 6% of organisations have sent in their data.

The data is now public. Organisations where the pay gap goes against women include Npower (19%), Cooperative Bank (30.3%), EasyJet (51.7%) and Phase Eight (64.8%).

Easyjet’s accompanying report demonstrates a tone-deaf understanding of the situation. ‘Pilots are predominantly male and their higher salaries, relative to other employees, significantly increases the average male pay at easyJet’. Just 6% of its UK pilots — a role which pays £92,400 a year on average — are women, whereas 69% of lower-paid cabin crew are women, with an average annual salary of £24,800. There is no explanation of how EasyJet have attempted to challenge this state of affairs.

Most of the big-name companies represented in the 500 reports insist that men and women are paid equally when in the same role and argue that it is an imbalance of women in lower-paying roles that skews the gender pay gap results.

The Financial Times (FT) highlights companies that are producing statistical data that appear to be improbable, like companies with a 0% difference and companies that have altered their data more than once. Unnamed ‘pay consultants’ have suggested that in digging up the data, employers have discovered they might be inadvertently breaking the law. The FT appears to be preparing the ground for no action on gender pay because the statistics are too difficult to collect.

A separate FT article in January noted that the ‘threats’ of sanctions and enforcements by the government are not enforceable, this time quoting employment specialist law firm Blake Morgan. There is currently a consultation out about what the sanctions should be, which was a criticism raised by trade unions before the scheme was introduced.

It is true that there is no short-term fix, and an attempt to name and shame has many flaws, but it is becoming clear that excuses are being lined up and that this scheme will be ineffectual. The pay discrimination is so widespread and so extreme that naming and shaming cannot be a solution. There are simply too many companies practising huge pay discrimination. They can hide in the crowd.

In the meantime, Carrie Gracie has highlighted yet again BBC gender pay inequality and a hot mike recording of John Humphreys and Jon Sopel complaining about her was leaked. An anonymous article by ‘BBC Women’ published on Comment is Free emphasises the fear that women feel speaking out and relates the lack of discussion to gaslighting, making women in the BBC feel that they are creating a problem not the other way around. The discussion between John and Jon and the reaction from the BBC seems to confirm that. Conditions at the BBC are simply the most public aspect of a near-universal problem.

#MeToo

The growing #MeToo movement – started in Hollywood in response to some truly shocking revelations about sexual harassment, notably by Harvey Weinstein – is calling ‘Time’s Up’ on silence.

The recently launched Time’s Up campaign, publicised largely by social media is currently a collection of 300 Hollywood women who have established a $13 million legal defence fund to provide support for women and men who’ve experienced sexual harassment or abuse in the workplace. This is a struggle against silencing women through non-disclosure agreements and the Time’s Up statement specifically acknowledges lower paid working women from other industries in their statement.

This movement to call out injustice faced by women is spreading and the collective approach is welcome. Because women really are on the frontline of poverty and the government policy of austerity.

Burden of austerity

Not only do women receive lower wages, they also disproportionately work in the parts of the economy that is being cut hardest, the public sector pay freezes and cuts have seen women disproportionately lost their jobs or forced go part time since 2010. That impact is still being felt a decade on from the Great Recession.

In addition, because public sector services are being closed down or reduced, the burden to perform these tasks – childcare, caring for elderly or disabled relatives has fallen to women as the traditional care givers, but also because they are being shut out of work, under paid and under employed. This triple-whammy effect is what is meant by the statistic that 86% of the cuts have fallen on the shoulders of women.

Some of the more excruciating examples of the cuts to social care come from women subjected to domestic violence who are falling through the cracks. Two women a week in England and Wales are killed by their partners/ex-partners. Yet across the country women’s refuge budgets have been slashed by nearly a quarter over the past seven years. Three quarters councils in England have reduced the amount spent on refuges since 2010. The system is at breaking point.

Worse – refuges who have won bids are reporting that they have not received the funds 8 months later, forcing one shelter to put its entire staff on notice out of fear of imminent closure. There are so many shocking highlights of how these cuts have hollowed out services – a month after Grenfell a ceiling of a refuge in the same borough collapsed and in a report by Women’s Aid, they announced that 78 women and 78 children were turned away from refuges in a single day in 2016.

The Tories announced £100million funding for services until 2020, with half allocated to local authorities in the form of ring-fenced grants. But this doesn’t have to be spent just on refuges – also homeless people, drug addicts or older people. This is miserably low amount given the scale of the problems.

Little known public proposals by the government plan to remove refuges and other short term supported housing from the welfare system, which could leave vulnerable women fleeing abusive partners unable to pay for their accommodation using housing benefit, the last guaranteed source of income available to refuges. On average, housing benefit makes up 53% of refuge funding.

Summary

In order to analyse how far women have come in a hundred years, we can’t look at the successful outliers who have done well, we should look at those who are at the very bottom and evaluate how far the positive changes made by women have affected all women.

The challenges that were faced by the Suffragettes in the early twentieth century for equal pay, better working conditions, housing, health and control over their bodies are still largely our unfinished business.

Even if the media are not watching and it is difficult to simply be believed, it is important to remember that women’s lives are deeply affected by the impact of austerity and should be central to challenging it, because the silent majority is building and those standing in our way will be on the wrong side of history.

Trump’s tax cut – short term gain, long term pain for the US economy

By John Ross

To assess the impact of the Trump tax cut on the US economy it is necessary to analyse the interrelation of two processes:
 
  • The determinants of US economic growth in the medium/long term,
  • The short-term position of the US economy in the current business cycle

Analysing these factors, the impact of the Trump tax cut on the US economy is clear:

  • In the short term the US economy is recovering in its current business cycle from its extremely bad economic performance in 2016, of only 1.5% growth, and the Trump tax cut is likely to boost this upswing
  • The tax cut will increase the US budget deficit, and therefore reduce the level of total US savings, thereby reducing US medium/long term growth – unless the US embarks on large scale foreign borrowing, which would directly contradict Trump’s aim of reducing the US balance of payments deficit.
In summary, the Trump tax cuts will create a pattern for the US economy of ‘short term gain, long term pain’. The rest of this article will analyse the reasons for these processes in terms of the fundamental determinants of US economic growth. A comment on the political consequences of these economic trends is given in the conclusion.
 
Determinants of US growth
 
In order to analyse the fundamental factors determining US economic growth in both the short and the medium/long term the correlations between the key structural features of the US economy and the US growth rate are shown in Table 1. This Table shows a clear pattern:
 
  • in the short term no single fundamental structural factor, except accumulation of inventories, is strongly correlated with US economic growth – and inventory accumulation is a passive factor merely reflecting the acceleration and deceleration of US growth. Leaving aside inventories, over a 1-year period the strongest correlation of a structural factor in US GDP with US growth is the percentage of net investment in US GDP, but this only accounts for 25% of US growth in a one-year period – a weak correlation. In summary, in the purely short term numerous factors – the situation in the business cycle, international trade, even the weather – can significantly affect US growth.
  • However, in the medium/long term there is an extremely strong correlation between structural elements of US GDP and US growth – the strongest positive correlations are shown shaded in grey in Table 1. The strongest correlation can be seen to be that between the percentage of US net fixed investment in the US economy, i.e. gross investment minus capital depreciation, with US GDP growth. This correlation accounts for the majority, 54%, of US growth over a five-year period and over a seven-year period US this correlation accounts for 72% of US growth – an extremely strong correlation.
Fundamental analysis, based on growth accounting, shows that high US next fixed investment causes high US economic growth rates. However, for present purposes of analysing the impact of the US tax cut it is not even necessary to establish this. The extremely strong medium/long term correlation of US net fixed investment with US GDP growth shows that it is impossible over the medium/long term to accelerate US GDP growth without increasing the percentage of net fixed investment in US GDP. Therefore, to analyse medium/long term prospects for the US economy it is necessary to analyse trends in US net fixed investment. This, in turn, directly interrelates with the consequences of the US tax cuts.
 
Table 1
 

The short-term position of the US business cycle

Analysing first short-term trends in the US economy this is greatly simplified by the fact that US medium/long term growth rate is among the world’s most predictable. Table 1 shows that over a 5-year period US annual average growth is 2.2%, over a 7-year period 2.1%, and over a 20-year period 2.2%. Only a 10-year period shows significantly different growth, at 1.4%, and this is simply a statistical effect of the huge impact of the international financial crisis of 2008. Given all these measures coincide therefore, annual average US GDP growth over the medium/long term may be taken as slightly above 2%. Given this stable medium/long term growth rate short term US business cycle trends simply show oscillations above and below this medium/long term average.

Table 2

Turning to the present situation of short-term shifts in the US business cycle, Figure 1 confirms that US economic growth in 2016 was extremely slow – only 1.5% for the year as a whole and falling to 1.2% in the second quarter. Given that the US growth rate in 2016 was substantially below its medium/long term average of slightly above 2%, a recovery of US growth was to be expected in 2017 for purely statistical reasons. This has duly occurred, with US year on year growth in the 3rd quarter of 2017 being 2.3% – marginally above the long-term US average.

The Trump tax cut is therefore being injected into an economy which is already recovering from its cyclical downturn in 2016. As the Trump tax cut is not accompanied by any equivalent reduction in US government spending it will therefore significantly increase the US budget deficit – estimates of the final effect of this are that the US budget deficit will increase by at least $1 trillion. A tax reduction which increases the budget deficit, that is which increases US government borrowing, may well increase a short-term recovery which is already occurring.

However, this increased budget deficit, other things being equal, will reduce US total savings – i.e. the sum of household, company and government savings. In the purely short term this fall in the US savings rate will not reduce US growth because, as was already shown, in the short term, i.e. one or two years, net saving and net investment are not closely correlated with US economic growth. Therefore, in the short term, the effect of extra spending arising from increased government borrowing, i.e. extra money flowing to corporations and consumers, may well lead to extra spending boosting already recovering US growth. For this reason, as already noted, in the short term, in 2018, the combination of the cyclical recovery and tax cuts is likely to lead to increase ‘short term gain’.

Figure 1

The medium/long term

However, in the medium/long term, as already noted, key structural features of the US economy, in particular net fixed investment, are extremely highly correlated with US growth. This, therefore, means that over the medium/long term analysing the trend in US net fixed investment gives an extremely clear guide to US economic growth performance.

Necessarily the effect of a greater US budget deficit is to reduce US total savings – other things being equal. As Figure 2 shows the US already passed into almost permanent US budget deficit and government borrowing from the late 1960s onwards – with only a short period of budget surpluses under Clinton. By 2017, although it had recovered from the depths of the international financial crisis, US government borrowing was still 4.0% of GDP even before the Trump tax cut kicks in.

Figure 2

The household and company sectors

In theory, as US total saving is the sum of government, household and company saving, increases in US household and/or company savings could offset a fall in total US saving caused by an increased budget deficit – for example theoretically companies and households benefitting from the tax cut would save their extra income. However, Figure 3 shows, however, that no increase in these other potential sources of US savings was in practice sufficient to overcome the effect of increased US government borrowing resulting from US Federal budget deficits. The result of substantially increased US government borrowing, not offset by trends in the household or company sectors, was therefore to produce a sustained fall in US total savings – that is in US capital creation. US net savings, which had been 13.1% of US Gross National Income (GNI) in the late 1960s, by 2017 had fallen to 1.7% of GNI.

Figure 3

Saving and investment

Turning to the relation between US savings/capital creation and the key chief structural determinant of US economic growth, net fixed investment, it should be recalled that total investment is necessarily equal to total savings. Investment may, however, be financed by either US sources or by borrowing from abroad. Therefore, a reduction in US savings, caused by an increase in the budget deficit due to the tax cuts, necessarily means that US total investment must fall unless an equal foreign source of savings can be found.

US presidents from Reagan to Obama were indeed prepared to use foreign borrowing to offset the decline in US savings – as Figure 4 shows. In the 3rd quarter of 1979, shortly before Regan came to office, the US was actually a net international lender of 1.0% of GNI. However, under Reagan the US embarked on massive international borrowing, this reaching a peak of 3.3% of GNI during his presidency. After a brief decline under George H W Bush, US foreign borrowing then expanded further under Clinton and George W Bush – reaching a peak of 6.1% of GNI in 2005. The shock of the international financial crisis then forced a reduction in US international borrowing, but it still stood at 2.6% of GNI in 2017.

Figure 4

Nevertheless. despite this very large increase in US foreign borrowing Figure 5 shows that this insufficient to entirely offset the decline in US savings and maintain the previous US level of net fixed investment. US net fixed investment fell from 10.5% of GDP in 1978, shortly before Reagan came to office, to a low of 1.7% of GDP in 2010 immediately following the onset of the international financial crisis. US net fixed investment has since recovered to 3.9% of GDP but this remains far below its previous peak level.

Given the extremely strong correlation between US net fixed investment and US economic growth which was already analysed this sharp fall of US net fixed investment necessarily greatly reduces US economic growth.

Figure 5

The slowdown in US growth

Given the close correlation of US net fixed investment with the US growth rate, the necessary result of this sharp fall in US net fixed investment was therefore also a progressive slowdown in the US economy shown in Figure 6.

Taking a 20-year moving average, to eliminate any short-term effects of business cycles, US annual average economic growth has fallen from 4.4% in 1969, to 4.1% in 1978, to 3.5% in 2003, to 2.2% in 2017. The extremely close correlation of the percentage of US net fixed investment in GDP with the US medium/long term growth rates already analysed means that the Trump administration cannot significantly accelerate US economic growth without increasing the percentage of net fixed investment in US GDP.

Figure 6

The choices facing Trump

The fundamental determinants of US economic growth therefore clearly show the choices facing the Trump administration which result from the tax cut.

By carrying out a tax cut unaccompanied by any government expenditure reductions the Trump administrations is lowering the level of US domestic savings. This in turn necessarily means a reduction in US investment unless an alternative source of savings can be found.

As previously analysed previous US presidents from Reagan to Obama partially offset this decline in US savings by large scale foreign borrowing. But this large scale foreign borrowing necessarily has consequences for the US balance of payments and therefore for Trump’s pledge to reduce the US trade deficit.

  • The current account of every country’s balance of payments is necessarily equal to the capital account of the balance of payments with the sign reversed – i.e. an increase in foreign borrowing must necessarily be accompanied by an exactly equivalent worsening of the current account balance of payments. Whereas previous US Presidents were prepared to accept a deterioration in the US balance of trade as the necessary price to pay for large scale foreign borrowing Trump made it a central pledge to reduce the US trade deficit – the chief component of the US balance of payments deficit. But it is arithmetically impossible for there to be an increase in US foreign borrowing without there being a worsening in the US balance of payments deficit – that is, in practice, without there being a worsening of the US trade deficit. The Trump administration is therefore faced with only one of two choices:
  • If Trump sticks to the target of reducing the US trade deficit then the US cannot undertake significantly increased foreign borrowing, net fixed investment will therefore remain low, and US economic growth cannot significantly increase in the medium/long term.

If the US increases foreign borrowing, in order to increase the level of US investment, then this will necessarily mean an increase in the US balance of payments deficit – and therefore the Trump administration will be forced to abandon its central pledge of reducing the US trade deficit.

Contradictions of Trump’s policy

It is therefore clear that by its tax cut the Trump administration therefore places itself in an internally contradictory position in which it is impossible to simultaneously meet two of its stated goals:

  • If the US does not increase foreign borrowing it cannot increase its level of fixed investment and therefore the US cannot significantly increase its growth rate – which was one of Trump’s key campaign pledges.
  • If the US does significantly increase foreign borrowing, in order to increase its level of fixed investment and therefore increase its medium/long term growth rate, the Trump administration cannot achieve its goal of reducing the US balance of payments deficit – on the contrary the US balance of payments deficit will increase.

If it should be argued that the Trump administration can find a way out of this contradiction by, for example, increasing the level of Innovation in the US economy this, unfortunately, rests on a misunderstanding. First, the close correlation between US net fixed investment and US economic growth shows that other factors are not powerful enough to compensate for a lack of net fixed investment. Second, the factual data shows that while a combination of innovation and fixed investment is extremely powerful in raising US productivity and growth, innovation unaccompanied by fixed investment does not significantly raise US productivity – for a detailed analysis of the US factual data see “Reality & myth of the US ‘internet revolution’

Other analyses

While the above analysis is made in terms of analysing the fundamental determinants of US growth it is also worth considering other analyses.

The IMF arrives at a fundamentally similar analysis to the above in its latest international projections – predicting a short-term increase in US growth in 2017-2018 but without any medium/long term increase in the US growth rate. Figure 7 shows more precisely that the IMF projects US 2.2% GDP growth in 2017, and 2.3% in 2018, before a decline to 1.9% in 2019, 1.8% in 2020, and 1.7% in 2021 and 2022. Overall the IMF projects annual average US growth in 2016-2022 of 1.9% – which is actually marginally below the average annual medium/long term US growth rate of slightly above 2%. Given the stability of US medium/long term growth, therefore, while the present author would agree with the IMF’s projected general pattern for the US economy, i.e. higher growth in 2017-2018 followed by a slowdown, he considers that US growth will possibly be slightly higher than the 1.9% annual average indicated by the IMF.

Gavyn Davies, former chief economist of Goldman Sachs, who runs one of the world’s most sophisticated ‘now casting models’, similarly concludes that while the pattern of faster US growth in 2017-2018 followed by slowdown is correct he predicts average US growth remaining just above 2%.

Figure 7

Lawrence Summers former US Treasury secretary has the same analysis. He characterises the increase in US growth in 2017-2018 as a ‘sugar high’ – the equivalent of the purely temporary short-term boost in human energy caused by taking a large dose of sugar. His analysis, given the self-explanatory title the: ‘US economy faces a painful comedown from its “sugar high”’ is that: ‘The tax-cut legislation now in committee on Capitol Hill exacerbates every important problem it claims to address, most importantly by leaving the federal government with an entirely inadequate revenue base. The bipartisan Simpson-Bowles budget commission concluded that the federal government needed a revenue base equal to 21 per cent of gross domestic product. In contrast, the tax cut legislation now under consideration would leave the federal government with a revenue basis of 17 per cent of GDP — a difference that works out to $1tn a year within the budget window.

‘This will further starve already inadequate levels of public investment in infrastructure, human capital and science. It will probably mean further cuts in safety net programmes, causing more people to fall behind. And because it will also mean higher deficits and capital costs, it will probably crowd out as much private investment as it stimulates.’

Politics

Finally, while the focus of this article is the economic prospects for the US, it is worth noting certain key US domestic and geopolitical trends which follow from this.

Under normal circumstances it would be expected that the relatively more rapid growth of the US economy to be expected in 2017-2018 would lead to favourable approval ratings for a US President. However, in addition to other purely political factors, opinion polls in the US show strong popular disapproval of the proposed tax cuts due to their being considered to be particularly favourable to the rich – polls show up to 58% of the US population disapproving of the tax proposals with only 37% approval. Overall a survey of US opinion polls on 16 December found 58% of US voters disapproving of Trump’s record as President and only 36% approving. It remains to be seen if the economic recovery likely to continue in 2018 will increase President Trump’s approval rating before the fact that the US medium/long term growth rate has not accelerated becomes clear. However, it is clear that a situation of continuing low US medium/long term growth will continue the present situation of instability in US domestic politics.

The reduction of the US savings level due to the increased budget deficit due to the tax cuts also has geopolitical implications. If the Trump administration turns to large scale foreign borrowing to try to increase US investment levels, and therefore accelerate growth, this will necessarily lead to a larger trade deficit. As this would clearly be contrary to one of Trump’s central campaign pledges it will lead to temptations to blame other countries for what are in fact difficulties created by the consequences of the tax cut – China may be a target of this. If, however, the US does not turn to foreign borrowing to boost investment and growth levels then US economic growth will not increase – which may also lead to seeking foreign scapegoats. In summary, the fact that the tax cut will not produce a significant acceleration in US growth, other than in the purely short term recovery in 2017-2018, may increase the temptation of the US to inaccurately blame other countries for what are in fact self-created economic problems exacerbated by the increase in the budget deficit.

Conclusion

In conclusion, the consequences of the US tax cut are therefore clear. They may be easily understood both in terms of the economic fundamentals considered and by those of other analysts including the IMF. The tax cut, by increasing the US budget deficit, will produce a ‘short term gain and long-term pain’, a ‘sugar high’ to use the term of Lawrence Summers. It will further boost a US recovery which is already taking place for statistical reasons in 2017-2018 but at the expense of undermining the US savings level and therefore the ability of the US economy to finance the investment which the data shows to be crucial for any significant increase in the US growth rate.

China’s economic policy, and that of other countries, must therefore be prepared both for the ‘short term gain’ of the US tax cut of 2017-2018 and for the ‘long term pain’, that is the low average US growth rate, that will be caused by the increase in the US budget deficit.

* * *

This article previously was published at Learning from China and originally appeared in Chinese at Sina Finance Opinion Leaders.

Jeremy Corbyn is right. Carillion should be a watershed moment.

.813ZJeremy Corbyn is right. Carillion should be a watershed moment.By Tom O’Leary

The collapse of Carillion was wholly made in Britain, although it has negative consequences internationally. Much of the coverage surrounding the failed outsourcing company focuses on its ailing business in Canada and the Middle East. This is a red herring. In its last-ever full year annual report and accounts (pdf) approximately three-quarters of the business revenues were generated in the UK (74% of the total, amounting over £3.8 billion).

The truth is Carillion has gone bust, putting vital public services and thousands of jobs at risk, because it and its component companies grew fat during the first phase of neoliberal economic policy and could not cope with the more recent phase, austerity.

The immediate cause of the collapse is a failed acquisition spree since the crisis began. This is highlighted by the fact that revenues were barely changed between 2010 (pdf) and 2016 at just over £5 billion and net assets actually shrank, even before the latest collapse to zero.

Yet the underlying cause is the disastrous relationship successive governments have had with the private sector. Whether the Thatcher/Major/Blair governments believed the nonsense they spouted about the superior efficiency of the private sector is immaterial. Only the wilfully ignorant could ignore the litany of failed privatisations and the extortion of PFI contracts that followed that followed their policies. The real purpose of Thatcherite economic policy, which has become widely known as neoliberalism, was precisely to hand state resources and revenues to the private sector.

Carillion, and the companies it acquired, expanded rapidly as it was fattened on the force-feeding of outsourcing, privatisations and PFI. Carillion’s ‘business model’ was to acquire as many of these companies as possible that benefited from public sector hand-outs and increasingly to hide the debt incurred in off-balance sheet special purpose vehicles.

The model came crashing down because of austerity. The main reason revenues are flat between 2010 and 2016 is that the Tories (and the Coalition before them) slashed public sector investment in roads, rail, ports and housing, and took an axe to real current spending, in areas such as education services, the NHS, the justice, system, and so on. The pace of new privatisations and PFI since 2010 was not enough to top up the bucket with a big hole marked austerity.

Where now?

Clearly, no tears should be shed for the private sector shareholders who continued to receive hefty dividends even when Carillion started to make losses. The directors continued to pay themselves hefty salaries and bonuses even as the company floundered. Some will be paid still.

It is those reliant on public services, that is the overwhelming majority of society who face even higher bills and lower living standards as a result of the collapse. The workforce will face job losses, and pensioners will be concerned about their futures. Mostly, this will be without the support of a union, as Carillion was viciously anti-union.

There must be no bail-out of the failed Carillion company. If possible, the directors and their advisers and auditors should be investigated to determine whether they are in breach of company law. Company law must change too. Directors must have a financial liability for this type of failure, including compulsory claw-back of salaries and bonuses, as well as liability for pension scheme failure. Auditors, lawyers and accountancy firms too must be held to account. A windfall levy should also be considered on all past and current holders of PFI contracts in order to fund the inevitable losses, with a view to driving PFI out of the public sector altogether.

The vital public service contracts for staffing prisons, cleaning hospitals and providing school meals and so on, should be taken back into public hands, the natural home for the provision of public goods. Similarly, construction activity must not be halted, the infrastructure deficit and housing shortages are already too great. The Carillion workforce and tens of thousands of workers in ancillary companies can be incorporated into new direct labour organisations.

The claim by George Osborne and Tory mayor of the West Midlands Andy Street that it was government failure to use ‘small and mid-sized firms’ in its contracts is ridiculous. The scale of these contracts is beyond the scope of these firms. Carillion used the familiar, monopolistic approach of buying up mid-sized rivals, which is a general tendency of private sector operations.

Above all, the fallacy that the private sector is intrinsically a more efficient provider of goods and services should die with Carillion. This cannot be true as the private sector is obliged to make a profit and the public sector is not. This is a failure of outsourcing, PFI and privatisation. They should all die with Carillion, and under a Corbyn-led Labour government that process can begin.

Longest slump on record – official

.696ZLongest slump on record – officialBy Tom O’Leary

The latest official forecasts for the UK economy show the longest slump on record. But there is official silence on the cause of the crisis, signalling no intention to change course to end it.
Instead, the Office for Budget Responsibility (OBR), the UK Treasury and Chancellor Philip Hammond all hint that slashing growth forecasts over the medium-term is somehow connected to the weakness of productivity growth and this in turn is in vaguely related to the weakness of investment. 

Officially, the weakness of UK productivity growth remains a mystery or a ‘puzzle’. In reality, the UK is just one of the more extreme examples of a phenomenon across the Western economies of weak productivity growth. 

In all cases, the cause is the weakness of Investment which determines weak productivity, and the UK is among the weakest because its investment has been among the weakest. The claim that it is instead caused by ‘measurement problems’ of the service sector or other imponderables is belied by the fact that a large service sector is common to all Western economies, yet the UK has badly lagged behind even the G7 average growth in productivity since the Great Recession. Productivity is weak in the G7 because investment is weak, and both are weaker still in the UK.

UK Great Stagnation

The Great Depression of the 1930s lasted less than 3 years but was only definitively ended by the war boom in 1940, ten years later. The Long Depression at the end of the 19th century lasted 12 years. According to the official OBR forecasts the Great Stagnation in the UK will last at least 17 years, with living standards failing to recover their 2008 level until at least 2025. 

The current crisis is an unprecedented duration of weakness. On reasonable assumptions from the Resolution Foundation, real average earnings will not recovery their 2008 level until 2025. At the same time Government departmental spending will on average have fallen by 16% in real terms between 2010 and 2022. It also forecasts that the current outright decline in living standards will last longer than the fall in the recession, 19 quarters versus 17 quarters. Claims that ‘austerity has ended’ are utterly foolish. 

The consequences of such a prolonged depression will be severe. They are already beginning to accumulate. The OBR forecasts for per capita GDP and especially the level of debt would have been worse, except that longevity is beginning to decline. This is almost unprecedented in an advanced industrialised economy in peacetime. Further deterioration is almost inevitable, at least under current policy.

Einstein’s definition of madness

In the Budget, Hammond did suggest that low productivity was linked to low investment. He went further, “The key to raising the wages of British workers is raising investment – public and private. And Mr Deputy Speaker, we are investing in Britain’s future.”

This should all represent progress. Except the last part of that statement is untrue. The Tory government intends to cut public sector investment further.

The level of public sector net investment reached 3.4% of GDP during the crisis under Labour and was instrumental in supporting a recovery. The Tories slashed public investment to 1.7% of GDP in 2013/14 and has only recovered to 2% since. Hammond intends to cut it close to its low-point in the next Financial Year to just 1.8% of GDP and barely increase it subsequently. See Chart 1 below.

Chart 1. UK Public Sector Net Investment as Percentage of GDP, 2000 to 2023
 

It is important to recall, Hammond and the official forecasters are close to acknowledging that weak investment causes weak productivity growth, and that this in turn lowers the growth of wages and living standards. But the Tories intend to do nothing to reverse the weakness of investment.

As many analysts have pointed out, the big set-piece of the Budget in tackling the housing crisis will encourage no new home building and simply drive up house prices. This is at a cost of £3.2 billion, when 40,000 new genuinely affordable homes could have been built. The Tories have boosted demand for housing without boosting investment. The textbook response is higher prices (or in this case, softening the possible house price fall).

It is a serious mistake to believe the Tory leadership are stupid. Theirs is not primarily a failure of diagnosis. The intention is not to address a crisis whose proximate cause they accept; the lack of investment.

The intention of the austerity policy is to transfer incomes from poor to rich, from workers to companies. The policy’s ultimate aim is to boost profits. This is why, from the Tories’ perspective, the state cannot interfere in the economy by investing on its own account, as this would remove sections of the economy from private sector profitability altogether. The thrust of policy is the opposite, to privatise as much of the economy as possible. In the footnotes to the OBR documents, it seems as if the government intends to sell off its remaining shares in RBS at a huge loss to the public sector, for precisely this reason. The NHS, education, rail and other sectors are all being opened to the private sector.

Labour’s alternative

Under John McDonnell and Jeremy Corbyn, Labour has entirely the correct framework of borrowing for Investment, not for current or day-to-day spending. The latter can be met and even increased substantially by increased taxation. 

This follows from the fundamentally correct point that only Investment can add to the productive capacity of the economy. Consumption cannot. Therefore only Investment can sustain growth. Borrowing (and incurring debt and debt interest) for spending without a return was a factor in the Western government’s inability to deal with the end of the post-World War II boom in the 1970s. At the same time, Western governments were divesting assets (privatisation) that had been rescued through nationalisation after World War II.

Rather than make the state more responsible for Investment, the Western governments instead chose to slash current spending, led by Thatcher and Reagan. The verdict is clear. In the 38 years since Thatcher first came to office the economy has grown by 126%. The same accumulated change in growth took place in the preceding 26 years. 

Labour’s current economic framework is a sharp break from that past. In effect, to spur recovery, Labour is willing to make inroads into the private sector’s domain by increasing state investment.

However, the question is now posed of what will be the appropriate level of that investment, in light of the official expectations that weak productivity means a permanently lower rate of growth, something more like 1.5% than 2.25%.

One factor in the response is Labour’s own fiscal rules. According to the OBR, at some point in the next few years borrowing for current or day to spending will end, possibly in 2019. Table 1. below shows the forecasts for Public Sector Net Borrowing and Public Sector Net Investment over the next few years.

Table 1. UK Public Sector Net Investment and Net Borrowing, 2016/17 to 2022/23, £bn
Source: OBR

The same trends are shown in Chart 2 below. Pubic Investment is forecast to exceed public borrowing at some point in the next few years.

Chart 2. Public sector net Borrowing & Net Investment, £bn, 2016/17 to 20222/23
 

Given how realistically downbeat the OBR now is, and assuming unchanged government policy, only an outright recession could push the cross-over point for public investment and borrowing into the very far future. This means day-to-day or current government spending at some point in the next few years will be more than covered by government taxation and other revenues.

A crucial difference is that Labour would maintain and increase government Investment for growth in living standards. The Tory stated plan is to eliminate borrowing altogether.

At the last election, Labour’s costings manifesto outlined £48.6 billion in taxation and other revenue-raising measures. According to the OBR, it will also a have further £21 billion in 2020 in headroom to increase current spending without having to borrow. To address the real damage to public services and pay, as well as to maintain and build political support for a radical government of the left, then most if not all of this £70 billion spending is likely to be needed.

Therefore at some point all of the new government borrowing will be for investment. The Labour fiscal framework already includes a ‘knock-out’ option, where borrowing on all items of government outlays can be increased if interest rates remain close to zero, which provides flexibility in the face of a recession.

But in light of the official acceptance that growth will now be ‘permanently’ lower, at least lower over the foreseeable future there is room for reconsideration of the borrowing targets for investment. The National Investment Bank and Infrastructure Commission should both have as their mission statement the ‘permanent’ raising of the productive capacity of the economy.

This may well require going beyond the current commitment to borrow £25 billion in additional funds over each of the next 10 years to fund investment. Even if the private sector matches this increase, there will still be a requirement for prolonged rate of much higher Investment to return even to the previous growth path.

The Tories are likely to bequeath Labour an exceptionally weak economy. Labour’s fiscal framework already allows the correct focus on government Investment. At the same time, the effects of severe austerity and Labour’s own tax plans already mean there is will soon be plenty of scope to increase government Consumption (current spending) without increasing borrowing. But to deal with the severity of the Great Stagnation under current official forecasts, much greater increased in borrowing for Investment may be needed.

John McDonnell is right, borrowing for investment does pay for itself

By Michael Burke

The manufactured furore surrounding John McDonnell in the wake of the Budget has a clear purpose. It is designed to distract attention from probably the grimmest set of forecasts delivered in a Budget in the modern era and to deflect criticism from the Tory government.

This is not solely an anti-Labour, pro-Tory propaganda campaign. Contrary to widespread assertions, austerity is not coming to an end and is being deepened. Seven years of falling living standards are not over. The Institute for Fiscal Studies (IFS), very far from being a left-wing thinktank, says that living standards will be lower in 2023 than they were in 2008.

This is a doubling down on the failed policy of austerity. It is therefore important for all supporters of austerity to shift attention from the repetition of a policy that has already failed.

Borrowing to invest

The immediate focus of the criticism of Labour plans was the absence of a specified level of interest of government debt arising from Labour’s borrowing. This is perhaps one of the weakest grounds to attack.

This is because Labour’s Fiscal Responsibility Framework is committed to borrowing solely for investment, and balancing current or day-to-day spending on items such as health and education with current revenues which is mainly taxation.

As a result, all of Labour’s borrowing would have a return. The combined effect of borrowing at low interest rates and investing with much higher rates of return is a net boost government finances, which can be used to increase Investment further. The level of government deficits and debt will fall automatically as taxation revenues grow along with increased economic activity.

Currently, government borrowing over any time period (or debt ‘maturities’ in the jargon) costs less than 2%. This is below the level of inflation, which alone means that the borrowing makes sense. Yet, at the same, the returns to commercial investment are on average around 12%. Any government, or business, which can borrow at such low interest rates for such high investment returns would be foolish to pass up this opportunity. It is reckless and extreme that the Tories have passed up this opportunity.

Of course, no-one can possibly know what the level of interest rates will be in a few years’ time. But the official forecasts from the Office of Budget Responsibility (OBR) suggest only a minimal increase on government borrowing costs (the yields on UK government bonds, or ‘gilts’) over the medium-term.

This is shown in Chart 1 below, with the green line in Chart 3.10 representing the latest forecasts of long-term borrowing costs. These barely move above 2% over the medium-term.

Chart 1. OBR Expectations of UK Interest Rates

In financial markets there is a calculation used to highlight where interest rates are expected to be in a given number of years’ time. Currently, using this calculation of the difference between 10year gilt yields and 20year gilt yields implies a market expectation that in 10 years’ time, 10year interest rates will be 2.3%. None of these forecasts can be relied on for pinpoint accuracy. Instead, they are shown to illustrate the point that it is reasonable to assume that government borrowing costs remain subdued for some time to come.

Rates and growth

The fundamental point is that when economies grow strong and especially when there is a risk of inflation, all long-term interest rates tend to rise. If the economy is performing strongly, then the pressure on Labour to borrow for investment when it comes to office subsides to some extent. But that is not what any serious commentator, the OBR, IFS or Resolution Foundation thinks is likely.

Instead, government interest rates fell sharply in response to the grim Budget outlook. This should be read as a ‘market signal’ that borrowing for investment should increase. Bond markets could absorb a lot more borrowing before gilt yields were pushed back up even to their very low pre-Budget levels.

The commitment of the Fiscal Responsibility Framework means it is easy to gauge whether the borrowing is sustainable. The decisive criteria is whether the return on the borrowing exceeds the cost of borrowing. As noted above, the average commercial return on investment in the UK is around 12%, a large multiple of the current cost of borrowing. Only if the cost of borrowing rose above that level would it become unsustainable. This seems unlikely in the foreseeable future.

In reality, the net returns to government from the same investment as the private sector are actually significantly higher. To take a clear example, a private developer who builds homes might get a return of 10-12%. But the same returns are available to government for the same project, while the cost are lower. This is because in the course of construction, income tax and National Insurance is paid by builders and other workers (and there is a return on their consumption too via VAT). This is a return to government which is simply not available to the private sector.

So, John McDonnell is right, and his critics are wrong. Borrowing for investment not only makes sense, it more than pays for itself.