Uncategorized

Data shows China’s ‘socialist development model’ outperformed all capitalist development strategies

Data shows China’s ‘socialist development model’ outperformed all capitalist development strategies

By John Ross
This article finds that the 1st, 2nd, 3rd, and 4th fastest growing economies during the period since the putting forward of the neo-liberal ‘Washington Consensus’ all follow, or are highly influenced by, China’s development model. These are the socialist states of China and Vietnam, Cambodia, and the Laos People’s Democratic Republic. Alternative development models, including the Washington Consensus, have been a failure in comparison. China’s economic model also far outperformed alternatives in poverty reduction.
These facts have international implications. The socialist development model followed by China was the unique creation of China’s economic policy as developed from Deng Xiaoping onwards. The Washington Consensus is the dominant economic strategy put forward by international economic institutions such as the IMF and World Bank.
The overwhelming economic superiority of the performance of countries following or highly influenced by China’s socialist development model shows that China’s economy not only outperformed alternatives but China’s economic strategy ‘out thought’ Western economic models.
A detailed theoretical analysis of the reasons that China’s development model outperformed alternatives is made in Chinese in my book 一盘大棋?中国新命运解析 (The Great Chess Game? A New Perspective on China’s Destiny). Shorter summaries may be found in English in my articles Deng Xiaoping and John Maynard KeynesWhy Adam Smith’s ‘classical theory’ correctly explained Asia’s growth and Deng Xiaoping – the world’s greatest economist. This theoretical analysis is therefore not dealt with here. The focus here is simply on establishing the facts – facts which clearly establish the outperformance by China’s socialist development model of any alternative.
* * *
This article compares factually the international results of two different economic development approaches – one which will be termed China’s ‘socialist development strategy’ versus the ‘neo-liberal’ Washington Consensus. The latter is the dominant economic development strategy advocated by the IMF and World Bank.
The reasons to make such a factual comparison should be clear. The wise Chinese phrase says ‘seek truth from facts’. Put in international language this dictum asserts the only basis of scientific analysis: that if facts and theory do not coincide it is the theory that has to be abandoned not the facts suppressed. ‘Dogmatism’, a fundamentally anti-scientific approach, consists of clinging to a theory even when the facts entirely contradict it.
Despite this requirement for factual study supporters of the Washington Consensus appear to strongly dislike systematic factual comparisons of the two development approaches. The reasons for this will become evident from the data below. This shows that China’s ‘socialist development strategy’ far outperforms the neo-liberal ‘Washington Consensus’.
The term ‘Washington Consensus’ was first coined in 1989 by US based economist John Williamson – although the actual practical policies were commenced in the late 1970s/early 1980s. The Washington Consensus is a classic form of ‘neo-liberalism’. It advocates in terms of economic policy privatisation and minimisation of the state’s economic role. Its social policy may be described as ‘trickle down’ – a belief that if there is economic growth all layers of society will automatically benefit as the benefits ‘trickle down’ from richest to poorest. Legally the Washington Consensus states the overriding goal is the strongest guarantees of private property. Politically, although claiming to be neutral, this combination of policies evidently favours capitalist and conservative political parties
China’s ‘socialist development strategy,’ which commenced with its 1978 economic reforms, is radically different in its entire framework and directly counterposed on key policy issues. China used, in Xi Jinping’s phraseology on economic policy, both the ‘visible’ and the ‘invisible hand’ – not simply the private sector but also the state. Indeed, in China itself, as the 3rd Plenum of the Central Committee of the 18th Congress of the CPC insisted: ‘We must unswervingly consolidate and develop the public economy, persist in the dominant position of public ownership, give full play to the leading role of the state-owned sector.’
In social policy, accompanying the economic dominance of the state sector, China did not rely on ‘trickle down’ but, in line with its socialist approach, China:
  • undertook massive and conscious programmes deliberately aimed at eradicating poverty – these are to be completed in the 13th Five Year Plan by 2020 by lifting the remaining 70 million people out of poverty;
  • China deliberately promotes development through urbanisation as a way of moving the population into higher productivity economic sectors;
  • China deliberately sought to narrow the income gap between rural and urban areas;
  • China does not rely exclusively on ‘the market’ but deliberately uses state infrastructure spending to raise the economic level of its less developed inland provinces;
  • legally China guaranteed private property but a key economic role was assigned to the state sector,
  • politically China was socialist.
What, therefore, were the factual outcomes of these two radically different approaches to economic development? To assess this, for reasons which will become evident from the statistics, not only will China itself be analysed but three other countries will be considered. These are Vietnam, which defines itself as socialist and which in reality drew heavily from China’s ‘socialist market economy’ approach, Cambodia, and the Lao People’s Democratic Republic – the latter two also being highly influenced by China’s development model.
The facts are summarised in Table 1 which shows the annual average rate of per capita GDP growth up to 2015 from 1978, when China began its economic reforms, from 1989, when the Washington Consensus was put forward, and from 1993 when data for Cambodia becomes available.
The data is of course extremely striking – indeed conclusive. From 1993-2015, when all four countries can be analysed China, Cambodia, Vietnam and Laos ranked respectively 1st, 2nd 3rd, and 4th in world per capita GDP growth – peripheral cases of countries with populations of less than 5 million or dominated by oil production are not included. From 1989, the date of the putting forward of the Washington Consensus, to 2015 China, Vietnam and Laos ranked respectively 1st, 2nd and 3rd in the world for countries in per capita GDP growth. From 1978 onwards China ranked 1st among all economies in terms of economic growth.
This ranking of growth necessarily shows that China’s economic model not only produced more rapid growth than developed economies but also capitalist economies at the same stage of economic development (level of per capita GDP).
Table 1
16 08 23 Chart 1
The degree to which economies influenced by the ‘China development model’ outgrew the world average was huge. From 1978 onwards China’s rate of growth was almost six times the world average Since 1989 China again grew almost six times as fast as the world average while Vietnam and Laos grew over three times as fast as the world average.
The contrasts not only of average per capital GDP growth but in eradication of poverty were overwhelming. From 1981 China lifted 728 million people out of World Bank defined poverty. Another socialist country, Vietnam, lifted over 30 million from poverty by the same criteria. The whole of the rest of the world, in which the dominant model advocated by the IMF was the Washington Consensus, lifted only slightly 120 million people out of poverty. In summary 83% of the reduction of the number of those living in poverty was in China, 85% was in socialist countries, and only 15% of the reduction in the number of those living in poverty was in capitalist countries.
This data, of course, also destroys the claim that is ‘capitalism’ which has produced rapid economic growth and poverty reduction. If capitalism were the motor of rapid economic growth and poverty reduction then this growth would be most rapid, and poverty reduction greatest, in capitalist countries. Instead it is in socialist China and socialist Vietnam that the greatest poverty reduction has taken place Socialist China and socialist Vietnam, together with the countries they influence Cambodia and Laos, have seen the fastest economic growth.
China’s ‘socialist development model’ therefore was a huge success while the Washington Consensus was a failure. Economic development remains the most fundamental issues for the overwhelming majority of the world’s population- on the latest World Bank data, 84% of the world’s population lives in developing countries. Any objective analysis based on aiming to maximise a countries development potential would therefore start with China’s ‘socialist development model.’ The facts of world economic development show that China’s development policies of a huge role for the state sector, large scale conscious policies to eradicate poverty, and a socialist political orientation were the most successful in producing both economic growth and poverty reduction.
The simple but decisive fact that the 1st, 2nd, 3rd and 4th most rapidly growing economies during the period of the Washington Consensus all use the ‘China socialist development model’ is the factual demonstration of the superiority of China’s socialist development path to any capitalist alternative.
Appendix
20 Fastest Per Capita GDP growth rates
16 08 23 Chart 2
*   *   *
This is an edited version of an article which originally appeared in Chinese at Guancha.cn.

John Rosshttps://www.blogger.com/profile/08908982031768337864noreply@blogger.com0

China’s economy growing 5 times as fast as US’

China’s economy growing 5 times as fast as US’By John Ross

During the last year some international financial media, with Bloomberg playing a particularly active role, attempted to present a picture of the world economy that the U.S. is growing strongly while the rest of the world, including China, is relatively weak. Publication of new U.S. GDP data confirms the truth is the exact opposite: The U.S. economy has slowed drastically with China growing far more rapidly than the U.S. Indeed, the U.S. in the last year has grown more slowly even than the EU.

Total GDP growth

The wise Chinese dictum says “seek truth from facts.” To establish the facts regarding the global economy, Figure 1 therefore shows the last year’s growth, up to the latest available data, in the three largest centers of the world economy – the U.S., China and the EU. The pattern is unequivocal. In the year to the 2nd quarter of 2016 China’s economy grew by 6.7 percent, the EU by 1.8 percent and the U.S. by 1.2 percent. The U.S. is therefore the most slowly growing major part of the world economy. Making a bilateral comparison, China’s economy grew more than five times as fast as the U.S.’ during the last year.

These three major economic centers together account for 61 percent of the world’s GDP at market exchange rates. No other economies have remotely the same impact on the global economy. Therefore, there is no doubt that in the last year it is the U.S. which has been the biggest drag on the world economy.

Figure 1

Per capita GDP growth

The situation in terms of per capita GDP growth shows an even more dramatic advantage for China. Population growth in China and the U.S. is rather stable – at 0.5 percent a year in China and 0.8 percent in the U.S. China’s and America’s per capita GDP growth in the year to the 2nd quarter of 2016 is therefore easily calculated – 6.2 percent in China and 0.4 percent in the U.S.

An element of uncertainty, however, exists regarding the EU’s population due to the refugee influx. Two estimates for the EU population are therefore used for calculation. One (“EU low population”) assumes there has been an influx of 1 million refugees over and above the EU’s 2015 0.3 percent population growth. The second (“EU high population”) assumes a refugee influx of 2 million.

These assumptions regarding the EU population naturally affect its own per capita GDP growth rate – producing rates of increase of per capita GDP of 1.4 percent or 1.2 percent depending on which population assumption is made. But either assumption confirms the EU’s superior per capita growth rate compared with the U.S. – in either case the EU’s per capita GDP growth rate is much higher than the 0.4 percent in the U.S.

It is also clear that U.S. per capita GDP growth, at only 0.4 percent, was extremely stagnant. During the last year, EU per capita growth was approximately three times as fast as the U.S. But China’s per capita GDP growth entirely outperformed both. China’s per capita GDP growth was more than 14 times as fast as the U.S.!

Figure 2

U.S. economic deceleration

It may be argued against these factual trends that future revisions to the U.S. may raise its estimated growth rate. This is a factual question which requires watching future data releases – it is also possible future data will revise U.S. growth downwards. U.S. GDP growth is sufficiently close to the EU’s, with a 0.6 percent gap, that is not impossible that U.S. GDP growth will be seen to be faster than the EU – although of course U.S. GDP growth will remain far slower than China. However, it may easily be demonstrated that huge revisions of the U.S. data would be required to alter the pattern that it is the U.S. economic slowing which has been the main cause of the downward trend in world economic growth.

To demonstrate this, Figure 3 shows year on year growth in China, the EU and U.S. for successive quarters since the beginning of 2015. The changes over that period are clear. The EU has maintained relatively consistent GDP growth of 1.8 percent. China’s GDP has slowed slightly from 7.0 percent to 6.7 percent. U.S. GDP growth however fell sharply from 3.3 percent to 1.2 percent.

Compared to the beginning of 2015, EU GDP growth has not fallen at all, China’s declined by a mild 0.3 percent but the U.S. decelerated by 2.1 percent. By far the most severe slowdown in the world economy has therefore been in the U.S. Only huge, and therefore highly implausible, revisions in U.S. data would be required to alter this pattern.

Figure 3

Conclusion

What therefore is the conclusion of the examination of the actual factual trends in the world economy?

· China continues to be by far the most rapidly growing of the major international economic centers. China’s total GDP in the last year grew over five times as fast as the U.S., and China’s per capita GDP growth was over 14 times as fast as the U.S.

· The chief cause of the slowing of the world economy in the last year is the slowdown in the U.S.

· The EU and above all China have outgrown the U.S. in terms of total GDP increase.

· U.S. per capita GDP growth, 0.4 percent on the latest data, is extremely slow.

· During the last year China and the EU have undergone either no or only mild economic slowdown while the U.S. has suffered a severe economic deceleration.

The factual situation of the world economy is therefore that not only has China been growing far more rapidly than the U.S. but even the EU has been growing more rapidly than the U.S.

Gross inaccuracy in international financial media regarding China is not unusual – they have, of course, been regularly predicting the “collapse of China” and a “China hard landing” for several decades. But the picture presented that the pattern of growth of the global economy has been strong growth in the U.S. and weak growth in China is therefore entirely false – it was the U.S. which showed to the weakest growth. Titles from Bloomberg this year such as “Fed Leaves China Only Tough Choices,” “Why China’s Economy Will Be So Hard to Fix,” and “Soros Says China’s Hard Landing Will Deepen the Rout in Stocks,” coupled with claims of the strong performance of the U.S. economy, are shown by the data to be simply inaccurate.

But international and Chinese companies, as well as the Chinese authorities, require strictly objective information – not claims which are the opposite of the facts. Perhaps the wise Chinese dictum should be modified to read “seek truth from facts – not from Bloomberg.”

The above article is reprinted from China.org.cn

A reply to Richard Murphy

A reply to Richard Murphy

By Tom O’Leary
The great potential of argument and dispute is that it leads to clarity of thought. Richard Murphy has done the left great service. In his broadsides against John McDonnell’s policy framework he has shown his own utter confusion. In this way, clearing up these confusions and clear misconceptions about economics nd economic policy provides an opportunity to clear out some dead wood from the left’s economic thinking. That the Murphy objections are unfortunately shared by a number of people who falsely believe that they are ‘keynesians’ or even Marxists only makes the task of clearance more important.
The John McDonnell framework is that there should be a balance on the current, or day to day Government spending over the business cycle. Borrowing should be reserved for the Government investment. Murphy acknowledges this in his piece. But he seems to have no understanding of what this means. As a result his critique of the McDonnell framework contains howlers. So, he argues that a commitment to balancing the current budget means McDonnell will ‘dampen the economy and at least partially withdraw cash from the economy’ at a certain point of the cycle. He also argues that the same commitment to balancing the current budget means being committed to austerity. Both of these points are nonsense.
The McDonnell framework places no upper limit on the level of Government investment at all. In the probable economic crisis McDonnell and Corbyn will inherit, Government will need very large borrowing for investment over the longer term, more than one parliament. Government will be boosting the economy for many years to come. The increase on the productive capacity of the economy via investment also means that capacity constraints are way off into the future.
Austerity and the deficit
This large scale increase on investment is not only the alternative to austerity, it is the opposite of it. Tory austerity is comprised of two elements. These are very deep cuts in public investment but public current spending has actually risen. This is not because, as some wild-eyed Tory MPs like John Redwood claim, because there has been no austerity. The cuts have been severe and deep. Women have borne the burden of them, and we await a study showing how black and Asian communities have suffered disproportionately.
But cuts to Government current spending and investment have not led to the elimination of the deficit. The deficit has not fallen at all because of austerity. George Osborne never understood why and it appears Richard Murphy doesn’t either.
The deficit has modestly fallen because of modest growth, caused by monetary easing, a falling pound, lower interest rates and Quantitative Easing. This has led to moderately rising tax revenues, not falling Government spending. It is growth that reduces the deficit. It is only growth which can eliminate it. This is exactly what John McDonnell intends.
How is this to be achieved? By increasing Government investment on a sufficient scale to restore robust growth. In this regard, Richard Murphy seems ignorant of two crucial facts.
  1. Any deficit is comprised of two components, expenditure and receipts. A commitment to eliminating the deficit says nothing at all about the level of expenditure alone. Deficits can be eliminated by increasing revenues, either through rising economic activity or (something Murphy ought to know about) tax reform to ensure lower tax evasion.
  2. The deficit on the Government’s current account is caused by economic weakness, primarily the weakness of private sector investment. Cuts to Government investment simply deepen this crisis. Therefore any increase in Government investment is expressed first as an increase in economic activity. This in turn is felt as an improvement in Government revenues, as tax rises and Government outlays on poverty fall. This is because the returns on an increase in Government investment come not to the investment account but to the current, or day to day spending. 

To illustrate this point, the Joseph Rowntree Foundation recently issued a report showing household poverty creates a cost to public sector current spending, the biggest cost of all falling on the NHS. The estimated cost is £78billion per annum, almost exactly the same as the total level of the public sector deficit. Put another way, eliminating poverty would eliminate the deficit.

But eliminating poverty cannot be achieved by increasing NHS spending (Government Consumption). Poverty could be eliminated by a very substantial increase in investment, led by public investment. This should create high wage, high skill jobs. It reduces the Government’s outlays on poverty and increases the Government’s tax revenues. This is what McDonnell means by eliminating the deficit on current spending. It is not cuts, but investment.

Economic Howlers

All of this passes Murphy by. Instead, he argues that the Government should be the ‘borrower of last resort’, but actually means that the Government should always run a current budget deficit. Otherwise, ‘cash is withdrawn from the economy’, by which he probably means that the private sector as whole will be obliged to reduce its net surplus.

Currently all three components of the private sector are running a surplus, the household sector (which should have net savings but has to deplete these because of the crisis), the company sector (whose large surplus consists of uninvested profits) and the overseas sector (composed of foreign investors who have been lending to the UK at a record rate, but may choose not to at any point).

These are the counterparts of the Government deficit. But no progressive, or Keynesian economist, or any socialist, would regard either an investment strike and profit hoarding by UK companies as a positive, or increasing indebtedness to overseas speculators as a welcome development. Yet these are the counterparts of permanent public sector current deficits, which Richard Murphy advocates.

But he also goes much further in an attempt to theorise his hostility to Corbyn/McDonnell and their economic framework. In a follow-up piece he argues that there is an identity between Government Investment on the one hand and Savings plus Imports on the other, and that Government Investment has no impact on Consumption at all (!):

‘In other words what the identity suggests has happened: what has been considered to be desirable investment has not lead to a growth in net consumption, which is what maters to most people. That’s not to say that there has been no growth, but most people have not benefited.’

This is an economic howler, which would produce a Fail for an Economics A Level student. Investment, Savings, Taxes and GDP, etc. are not fixed amounts. The factor which increases the aggregate total is Investment. Increased Consumption requires first increased Investment. Under Murphynomics the Industrial Revolution was a waste of time. Government should have increased borrowing to buy more gruel instead.

Consumption versus Investment

Keynes, unlike the self-styled ‘keynesians’, was very clear that the decisive factor in economic growth is investment. Against his critics, he argued that this was the central theme of his ‘General Theory’. This is an important point of agreement with Marxists and indeed most rational economic schools. Marxists are in favour of the development of the productive capacity of the economy (the ‘productive forces’). Keynes, in seeking to regulate the level of investment in order to prevent slumps accepted the need for a ‘somewhat greater socialisation of the investment function’. By contrast the ‘keynesians’, like Osborne seek to regulate the consumption function, and let big business and the banks determine the level of investment in the economy. It is their non-investment which is responsible for the current crisis.

Murphy charges McDonnell of seeking no fundamental change in the economy. Like virtually all of his charges this is posted to the wrong address. It should be a self-criticism of the ‘keynesians’. British post-WWII relative and spectacular economic decline was accompanied by and in part a product of ‘keynesian’ demand management and permanent deficits on the Government’s current account. This is the status quo.

A key reason why the current leadership of the Labour Party is so vilified is precisely because its domestic agenda breaks with that status quo. A very large increase in Government Investment would entail in Keynes’ term, some increase in the socialisation of the investment function. In Marxist terms the state would increase its ownership of the means of production. This is desirable for economic and democratic reasons, and is something which has been fought against by every British Government after Attlee.

Richard Murphy has betrayed his own lack of economic understanding with his misjudged attacks. But if others can learn from his mistakes, clarity can come from confusion.

The Corbyn Government and the private sector

The Corbyn Government and the private sectorBy Tom O’Leary
There has been a furious and ill-informed reaction to comments by Jeremy Corbyn and John McDonnell regarding the pharmaceuticals industry. This follows a renunciation of Corbynomics by the well-known blogger Richard Murphy. Both cases illustrate widespread confusion on the left and on the centre of British politics about the economy and its driving forces. Confusion is never helpful, and may be highly damaging and so it should be ended.

The central problems of British politics are that the Tory Party believes it understands the fundamentals of economic policy and that many on the Labour side share this high opinion the Tories hold of themselves. The fact is that the Tory Party has been in office for the overwhelming majority of the last 150 years in which time Britain has experienced a continuous relative economic decline without precedent in the modern era.

The Tory notion, that as business runs the economy then whatever business wants must be good for the economy, has been maintained throughout this decline and is even used as a justification for it. It is claimed that alternative policies would have been worse despite the mass of evidence provided by other countries who have experienced an enormous advance in their relative economic weight in the world economy over the same period. In economics, the Tories forget nothing and have learned nothing. It is not possible to offer economic solutions to the current crisis by mimicking them, as many in the Parliamentary Labour Party wish to do.

Corbynomics in government

The purpose of a political party is not to strike a pose or make propaganda but to wield power in support of the interests it serves. Jeremy Corbyn and John McDonnell reject the failed Tory nostrums of austerity, under-investment and chronic decline. In the economic sphere their aim is to achieve office in order to boost the living standards of the population, address key threats such as climate change and inequality and to ensure that the overwhelming majority of the population enjoy a far greater share of the wealth they create.

The context for this programme is that the private sector is the dominant component of the economy in Britain and will be for the foreseeable future. But the foolish Tory/Labour right notion that everything the private sector wants should be delivered is blatantly false in the era of the Panama Papers, Mike Ashley and Philip Green.

Instead a sober assessment is required of the strengths and failings of the private sector and government intervention should obviously be designed to strengthen the former and correct the latter. Overall, the current crisis was caused by the failure of the private sector to invest and has been extended by their continued refusal to organise an investment recovery.

There is a list of industries in Britain that have completely failed to deliver the necessary level of investment. There is a homebuilders’ sector which builds no homes, an energy sector which is keener on pollution through fracking than investing in renewables and which has led to power shortages being officially predicted this winter, and a set of railway companies which couldn’t run a whelk stall despite receiving a bigger government subsidy than British Rail. Crucially, Britain now has the highest level of charges for higher education in the world and yet a below-average attainment of a Master’s degree or above in the OECD.

The essential approach to these industries is that the private sector has failed to invest so that the public sector must. In some cases this means (re)nationalisation. But in all cases it means that the public sector regulates the level of investment at a much higher level and that the benefits or returns on this investment must also accrue to the public sector in order to be sustainable. This means the government or local authorities and others building homes. It means the state investing in renewable energy and energy storage and levying the energy sector companies to contribute to that. It means taking over the train operating companies and boosting investment via Network Rail. In education it means scrapping fees and raising the universities’ budgets so that they can increase their level of R&D and investment.

There is a separate category of profitable industries, many of whom employ large and well-paid workforces. These include banking and financial services, the military sector and pharma. There are others. Even here spectacular failure is possible so that nationalisation is unavoidable, such as Lloyds and RBS banks or potentially a large chunk of Rolls Royce. But in all cases the role of a radical government of the left is to harness those industries for productive use. This includes directing them towards useful new activities and ending subsidies and tax breaks for useless or harmful activities, using public purchasing, tax changes, regulatory measures and legislation to promote useful investment and deter damaging activities. To take just one very simple example, George Osborne cut tax credits for business investment in 2011 to in order to fund a cut in the rate of Corporation Tax. This is a net benefit to companies that do not invest at the expense of those who do, and should of course be reversed.

Harnessing these industries for productive use means banking becomes a channel for investment not speculation, the defence industry shifts into civilian use technologies such as industrial hardware, scientific research, civilian marine, aerospace and satellite production and so on. For pharma this means shifting R&D from ultra-expensive questionable palliative and non-essential drugs towards effective generic drugs and drugs to tackle the big global killers, malaria, heart disease, HIV/AIDs and so on which are currently neglected. In this way pharma is subordinated to the NHS and global health needs. For each of these industries there will also be strong benefits through government increasing its own funding for investment.

A third group of industries are mainly in the retail or service sectors, everything from real estate activity, to the leisure industries to personal services such hairdressing and high street shops. This group also increasingly includes functions such as social care and others formerly carried out by the public sector which have been outsourced to the private sector. Many, not all, of these are low-paid jobs. The role of government is to ensure that they are properly regulated, both in terms of staff and in terms of their customers. The National Minimum Wage, the fight for pay and job equality for women, black people and others and all forms of worker protection should be rigorously enforced across all sectors, but these are the sectors which include the most egregious employer offenders. Childcare needs to be placed on a well-funded collective enterprise, not a ramshackle and over-priced home industry as is currently the case.

Across all sectors the principles are to use whatever is the most effective lever to increase the level of the investment in the economy and ensure that the benefits of that are shared more equally among the overwhelming majority of the population. People’s Quantitative Easing, a National Investment Bank and regional offshoots, increased borrowing for investment all means to achieve that end. The state must aim to regulate the level of investment in the economy and that level must be much higher than currently. This is the road out of the crisis.

Norway, Switzerland or Albania?

Norway, Switzerland or Albania?By Tom O’Leary

The Brexit referendum campaign was dominated by assertions that the UK economy could benefit from access to or participation in the EU single market while opting out of the conditions on Freedom of Movement for workers. These assertions are false. This was continued during the strange Tory leadership contest, which had more casualties than debates, and has been repeated by the new Prime Minister and some of her key allies. This is a reactionary myth, with the potential to do great harm to the economy.
The former Justice Secretary and chair of the official Leave campaign Michael Gove dropped a bombshell in the Brexit campaign that not only would the UK be leaving the EU, which was on the ballot, but that a Leave vote meant we would be departing the single market too, which was not on the ballot. Gove made this highly damaging pledge because he followed the logic of the two official campaigns, which had been fought primarily on the terrain of anti-immigration. He understood that there was no realistic possibility of restricting Freedom of Movement (FoM) for workers while remaining inside the single market. 
Like Farage, Gove was effectively choosing impoverishment and lower immigration over prosperity and higher immigration. It was largely dismissed with derision, as Gove said the model would not be Norway’s or Switzerland’s relations with the EU, but those of Albania. All three countries are outside the EU. But Switzerland and Norway are part of the single market whereas Albania is not. Switzerland and Norway both have to accept all the conditions of access to the single market including Freedom of Movement (and pay far higher per capital contributions to the EU Budget than the UK does).
Elsewhere, confusion on the relationship between the single market and Freedom of Movement continues to dominate public discussion on this topic post-referendum. It is also in danger of infecting the debate inside the labour movement. For both reasons, it is necessary to set out the correct position:
  •  Under current circumstances and for the foreseeable future membership of the EU single market is crucial to the prosperity of the UK economy; living standards will fall outside it
  • The Freedom of Movement is a fundamental pillar of the single market, not an add-on or trade-off with it
  • In both cases, the single market and its Freedom of Movement component raise living standards in this country greater than they would otherwise be
  • The notion that it is possible to negotiate with the EU to access the single market while restricting Freedom of Movement (FoM) is false. It is unacceptable to the EU as a whole.

The nature of a market
A market allows the exchange of commodities. Any capitalist economy is a market on a grander scale, a series of interlocking markets. This exchange allows for what Adam Smith called the division of labour. Marx’s more precise term was the socialisation of production. This is the most powerful force in economic development. Adam Smith’s ‘Wealth of Nations’ was devoted to the outworkings of the division of labour. For Marx, the socialisation of production is the economic base of socialism.
To illustrate this point, no-one reading this piece on a laptop or a phone built that laptop or phone themselves. In a modern economy even the technology we have come to take for granted relies on a vast array of inputs of basic goods, different stages in the production process and an army of hundreds of thousands of workers to produce those goods, to develop, refine, market, transport, sell and service them and their various components. This army and this production process takes place across continents. Adam Smith argued it would take an enormous time for a single labourer to create just one pin from scratch. It would take an eternity to create a laptop from one individual’s labour.
Of course, the exchange of commodities in the market is unequal. The owners of the means of production can claim for themselves a huge proportion of the value created by the labour of others (which is one of the arguments for the common ownership of the means of production). But the benefits of the division of labour/socialisation of production cannot take place at all without the exchange that a market allows.
So too is the exchange between countries unequal. Many economies, most of them former colonies were unable to develop domestic industry before the whole world was already dominated by huge multinational enterprises. They often need to restrict access to their markets in order to develop domestic industry. This is a trade-off as costs are higher and technology necessarily poorer. But it is entirely legitimate for an oppressed country to take this detour so that is can later enter the world market. Britain is not an oppressed country.
In both cases, the optimal rate of development is ultimately produced by fully participating in the division of labour/socialisation of production. But because markets allocate resources on the basis of profit, not human needs, the optimal rate of development of the economy is when the market is allowed to fly freely within the iron cage of the state.
Continental-sized economies
The superiority of the capitalist system over its predecessors lay largely in its ability to harness the productive capacity of the whole economy and raise it up to a higher level. This was initiated on the basis of the nation-state, which necessitated in most countries sweeping away feudal domains, princes and kings, as well as their laws and restrictions on all the factors of production to create a single market. Those factors of production are goods, capital and labour. But as soon as feudalism was overthrown and supplanted by capitalism, most classically in the case of the Britain, production began to penetrate overseas markets. Capitalism necessarily created modern nations and immediately began to operate internationally.
In the modern era, entire economies are being organised on a continental basis and integrating into the world economy through that medium. The growth rate of trade within those continents is growing far faster than their external trade. North America, China and the EU are continental-sized economies. India may soon join them and it is to be hoped that so too will Latin America and Africa.
Irrespective of it size, to develop the potential of any market there must be free movement, distribution and exchange of commodities within that market. One of those commodities is labour. It would be impossible to imagine, say, a properly functioning market to build houses where bricks, wood, slates and so on could be freely exchanged, and builders were free to borrow to pay for them, but labour was excluded. The whole economy includes all sectors and construction serves here as just one illustrative sector. Freedom of movement of labour is integral to the optimal function of any market.
The EU Single Market
It is widely understood that the EU single market is vital to the maintenance of living standards in the UK. Even most of the Leave campaign leaders still want access to the single market. The greatest vulnerability in the current crisis is unlikely to be trade, even though new tariffs are likely to raise prices and cut exports to a certain degree. The bigger negative response is likely to be felt in terms of investment.
All large-scale firms operating internationally, wherever they are located, achieve market position and dominance by directing their activities towards the largest possible market, the UK’s vote to retreat from the EU will deter some proportion of large-scale investment, either by firms based in Britain or firms who might otherwise have invested here. Unless there were radically different economic policies where the state directs the bulk of investment, which is not on off in a country like Britain, then any economy dependent mainly on private investment will suffer outside the single market.
The EU and all its major component economies and political parties are committed to the operation of the single market including the Freedom of Movement. However they rationalise this, it derives from an understanding that they too would suffer economically if the single market were broken up. They are committed to FoM as an integral part of the single market for the same reason. Quite literally, it is only Little Englandism which opposes free movement.
Therefore the notion that effective membership of the single market can be achieved while restricting free movement of workers is a fantasy. It is a reactionary fantasy because it implies that FoM is a negative factor, unlike the movement of goods, capital and firms. Michael Gove recognised the unreality of being in the single market and promising to cut immigration, and so opted for the Albanian model. The EU cannot adopt that model, or allow others to while accessing the single market. Every train, lorry, car and van crossing borders would need to be opened to check whether the driver and passengers had the right to reside in the country.
Now that the Tory party has done its blood-letting, at least for now, its Brexit negotiations will be obliged to return to the real world.
It is imperative that the Labour Party stands for policies that will raise the living standards of the population. In that context, this means committing to membership of the single market and of course the free movement of movement of workers that makes it possible.  

Theory of under-consumption cannot explain the current crisis

Theory of under-consumption cannot explain the current crisisBy Michael Burke

Incorrect ideas usually reflect a one-sidedness or distorted analysis of a problem, reflecting one or a limited series of factors rather than encompassing the totality of all important factors, their proper weight and their inter-connection. So, the theorists of the Medieval church who insisted that the Sun and the planets revolved around the Earth could point every morning to the dawn and every evening to the sunset. The Earth was the centre of the Universe. Famously, what they could not explain is why Jupiter’s moons revolved around Jupiter or later, more prosaically, why a tall ship disappears gradually beyond the horizon, its tallest mast disappearing last. The theory explained one phenomenon but could not withstand new evidence.

The theory of under-consumption is espoused across a variety of schools of thought, in mainstream economics as well as by some of those describing themselves as either Keynesians or Marxists. It bears the same relation to scientific analysis as the ideas of the Medieval church do to astronomy. This is meant in a strict sense. Under-consumption can be used explain one or more phenomena, but cannot explain an all-encompassing crisis such as the current slump. It does not stand up to the evidence.

In a ‘normal’ or average business cycle downturn it might appear that some combination of household or government spending, or private sector investment or exports start to fall more or less simultaneously and GDP as a whole weakens. (Very often, behind the apparent widespread downturn is the leading role of falling business investment, but that can be set aside here). Some change in fiscal or monetary policy, increased government spending, lower interest rates, or a lower currency and so on may off-set the slump, ‘demand’ recovers and expansion resumes across all sectors of the economy.

But under-consumption cannot explain this crisis (or severe downturns in general). This is shown in a stylised account of the current crisis of the British economy using annual data. Fig.1 below shows the level of GDP, Consumption and Investment in real terms from 2007 to 2015. The data table is shown below for clarity.

The pre-recession peak of activity was in 2007. From that point to the low-point of the slump in 2009 GDP fell by £77 billion. Over the same period Consumption fell by £29 billion and Investment fell by £50 billion. Even though Investment is a far smaller component of total expenditure it fell by far more than Consumption. It was an Investment-led slump.

UK Real GDP, Consumption and Investment, £mn
 

The period since has been the weakest economic recovery on record. Annual GDP only surpassed the 2007 level in 2013. Over that time GDP rose by £34 billion while Consumption rose by £20 billion. But Investment was still the main brake on the recovery, down £31 billion from its peak level.

The most recent data to 2015 show GDP has increasd by £124 billion from 2007. Consumption has risen by £92 billion. But Investment has not recovered, being less than £1 billion higher in 2015 than in 2007. Worse, Investment has begun to contract once more in the latest two quarters. Therefore a GDP increase of £124 billion and a Consumption increase of £92 billion has led to zero increase in Investment, which is now declining.

Consumption has risen in the UK economy since the slump. But Investment has not. The theory of under-consumption, with the policy prescription that boosting Consumption will itself lead to a recovery in Investment has been demonstrated as false. The same pattern is true in the US and the Eurozone economies. Consumption is higher but Investment is flat or lower.

This is because private sector Investment is not determined by the level of Consumption but by profitablity. Without a rise in profits, private investment will not rise. Therefore it falls to the public sector to Invest, or wait until the private sector businesses graciously deign to invest once they see fit, perhaps destroying existing factories and offices and jobs first in order to recover profitability.

All theory is supposed to be able to explain the world. The theory of under-consumption cannot explain the world and the actual performance of the most advanced industrialised economies since the crisis. The theory is demonstrably false and should be junked.

Tory economic policy: “Welcome to Slumsville”

Tory economic policy: “Welcome to Slumsville”By Michael Burke

In what is probably a desperate attempt to stay politically relevant Chancellor George Osborne has announced a ‘5-point plan’ the centre-piece of which is an undated intention to cut the Corporation Tax rate to 15%. This is justified in terms of attracting investment to off-set the shock of the Brexit referendum outcome. It will do nothing of the sort. The effect will be to reduce further the funds available for public sector investment. As this deepens the investment crisis of the UK economy Osborne’s claim that this cut signifies that ‘Britain is open for business’ is false. Instead it indicates ‘welcome to a low tax, low investment Slumsville’.

Emergency measures to boost investment are almost certainly needed in the wake of the Brexit vote. Private sector investment was already in recession (two quarters of contraction) before the vote. As investment is the most volatile component of output it is likely that the first and most damaging effect of the shock will be further sharp reductions in private sector investment. But it is a myth that investment increases with reductions in Corporation Tax, as proved by Britain’s own recent history

SEB has previously shown that repeated cuts to the level of Corporate Tax (on profits) have not led to an increase investment at all. This is illustrated in Fig.1 below which shows the level of the CT rate and business investment as a proportion of GDP.

Fig.1 UK Corporate Tax Rate and Business Investment, % GDP
 

The highest levels of business investment in this period were when the CT rate was at 30%, close to its highs. After the slump business investment staged a weak recovery from 2009 onwards while the tax rate was unchanged. But repeated cuts to the tax on profits under Tory governments saw business investment stall. As noted above business investment has begun to contract once more even while the CT rate is at its low.

This should not be surprising. Business investment is driven by returns or profits. If Company X makes profits of £1 million and pays a 30% CT rate then the net profits will be £700,000 and it may be attractive to invest further. But if the same Company X makes profits of £500,000 and pays just a 20% CT rate of its net profits are just £400,000. This may be too low to attract investment.

Private investment is driven by returns not tax rates. Otherwise, Bulgaria, with a 10% CT rate would be one of the high investment economies in Europe with commensurately high living standards and Germany with a 29.65% CT rate would be one of the low investment economies with low living standards. The opposite is the case.

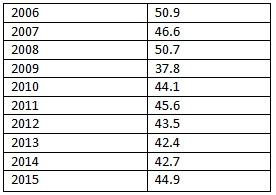
But the effect of the CT rate cut is worse than neutral. The UK Treasury works with the assumption that each 1% cut in the CT rate reduced Government revenues by £2 billion. Table 1 below shows the level of CT revenues by year.

Table 1. Corporate Tax revenues 2006 to 2015, £bn
Source: ONS
 
In 2006 the CT rate was 30% and the CT revenue was £50.9 billion. Therefore the taxable profits in that year were £169.7bn. In 2015 the CT rate was 20% and the CT revenue was £44.9 billion. Therefore the taxable profits in the year were £224.5 billion. Over the period profits rose by £54.8 billion yet the tax revenues from those profits fell by £6 billion.

Just as lower tax rates have failed to lead to any improvement in the level of business investment, restoring the CT rate would not lead to a slump in investment. If the CT rate had been maintained at 30% the revenues on the level of profits recorded in 2015 would have been £67.3 billion, or £22.4 billion more than actually recorded. A 10% cut in the CT rate led a £22.4 billion decline in revenues, slightly worse than but overall in line with the Treasury model.

With these additional Government revenues it would have been possible to fund very extensive public sector investment programmes. These would generate high-skilled and highly-paid jobs, boosting the level of economic activity and productivity. The projects themselves could be taken from the Government’s own National Infrastructure Plan, about which there has been so much publicity and so little activity. Previous experience shows that those parts of the private sector benefiting from increased public sector investment respond with increased investment of their own. This is the road that the Government should now go down in response to the crisis, providing a public sector-led investment response to the crisis. 

But the Tories strive at every turn to reduce the role of the state, even as the banks, the housing association sector and now possibly the social care sector falls into state hands as the private sector atrophies under the crisis. Unfortunately, the Labour right in the person of Alistair Darling signed up to the Osborne fantasy ‘Emergency Budget’, which even Osborne is not so reckless to implement. This signifies complete inability to learn anything from the economic crisis of the last 9 years. 

The only significant political force which understands the need for increased public sector investment in response to the crisis is the Labour leadership under Jeremy Corbyn and John McDonnell. Yet they are under attack, it seems, not despite their correct understanding of the solution to the crisis, but because of it.

Migration is an economic benefit

Migration is an economic benefit
By Michael Burke

Migration is an economic benefit which has the potential to lift the living standards of the whole population. Unfortunately, the debate on the EU referendum has been dominated by the two official campaigns, both of whom are anti-immigration. The leaders of the Leave campaign are the more virulent of the two. This is an economic (as well as political) dead-end, which will deepen the current economic crisis rather than end it.

As human society has developed its basic economic unit has grown ever larger. Societies have moved from being based on the tribe or similar entities through estates to towns and villages and to the nation state, including barbarisms such as slavery along the way. A key contributor to these successive developments has been the movement of goods and people as well as capital. 

Capitalism developed in the city-states of northern Italy and reached its flowering first in the nation states of Holland and England, with the flow of goods, people, capital and expertise playing a decisive role in each case. It is evident that the US could not have reached the heights of becoming the world’s leading economic power with the highest standards of living of its population without migration on a vast scale, as well as the forced migration of slavery on an unprecedented industrial scale. Less widely acknowledged, it was the immigration of the Huguenots and Jews fleeing persecution in Europe, the mass migration forced by the Highland clearances, the migration-by-starvation practised by Britain in Ireland that provided the raw material, cultural links, language skills and expertise which contributed to and helped to sustain the English Industrial Revolution. 

Goods, services and above all capital itself are in now constant motion around the world. These are all among the physical manifestations of what Adam Smith called the division of labour, or what Marx called the socialisation of production. That is, the production process itself becomes ever more complex and intricate, requiring ever-greater specialisation in ever-larger marketplaces across national borders in order to increase efficiency and so maximise profits. A key contradiction is that capitalism has become a global system while still resting on the nation-state. 

The advocates of restricting freedom of movement within the EU such as Cameron, or withdrawing from the EU and the single market in order to prevent it such as Gove, Johnson and Farage are literally reactionary. They attempt to oppose a process of migration which has been present since the dawn of humanity and which has increased as human society has progressed. They wish to resolve this contradiction by going backwards. A nostalgic and unfeasible version of the nation-state takes precedence over the actual development of society and the economy. 

Four Freedoms

The European single market is built on ‘Four freedoms’, the freedom of movement of goods, of companies, of capital and of workers to move across borders within that market. The reactionaries wish to limit the freedom of just one of those, the movement of workers. The effect would be twofold. First, the functioning of the single market would become less efficient and average prosperity would be lower as a result. The division of labour/socialisation of production would be hindered. Secondly, within the single market it would be the bargaining power of labour that would specifically decline.

Even in the heyday of rising British industrialisation there were restrictions on the freedom of movement of workers, known as the Poor Laws which kept the unemployed from seeking work outside their parish. In this way a permanent reserve army of labour was prevented from going AWOL, and kept as a permanent threat to those in work. The Poor Law legislation was only finally abolished by the progressive post-war Labour Government in 1948.

If companies and capital are free to move, but workers are not then the easiest trick for employers to pull is to say, “accept these worse terms or lower wages, otherwise we will move to A N Other country”. Tata Steel is currently deploying a variant of this, “gives us these subsidies and allow us to cut pension entitlements, or we will fold the British business”.

It would be even more reactionary to respond that these four freedoms should all be limited, precisely because it reverses the trend socialisation of production. When increasing overseas trade last gave way to national protectionism in the 1930s it led to global economic slump.

Labour share

There is a separate objection that the fruits of these freedoms, and of globalisation more generally have been disproportionately claimed by big capital, the large banks and multinational firms. But this is increasingly true of all positive economic developments as the share of national income in the advanced industrialised economies is increasingly claimed by capital, not by labour. 

But no serious commentator suggests we should abandon the benefits of mass telecommunications because of the enormous profits made by Apple, Amazon, Microsoft and so on. Returning to the pigeon post is no more sensible than restricting free movement of workers. How the benefits of economic advances are distributed is an independent matter, a product of the struggle between classes. But the working class cannot claim a greater share of these benefits if the benefits themselves have disappeared.

It is not possible to find a way out of the economic crisis by advocating policies that would deepen it, such as protectionism or restricting the freedom of movement of workers. Socialists advocate the increasing socialisation of production; greater investment, greater free education, growing trade, free movement of workers because these raise the material well-being of society as a whole, especially the material well-being of workers and their dependants. This is where the term socialism comes from.

Migrants to Britain create twice as many jobs as their proportion of the population, 14% versus 7% to 8%. They are net direct contributors to government finances of approximately £20 billion per annum, over and above anything they receive in social protection. The indirect fiscal effect is far greater, taking into account the employment creation noted above. Whatever the claims and counter-claims of the two warring Tory factions in charge of the EU ‘debate’ the truth on migration is very simple: Migration is an economic benefit.

Why Osborne fails to cut the deficit- and how John McDonnell can

Why Osborne fails to cut the deficit- and how John McDonnell can
By Michael Burke

As the UK economy is slowing once more, it is likely that the public sector deficit will begin to rise again as it did in 2012 under the impact of economic stagnation. George Osborne’s claimed target of deficit-reduction will once more recede on the horizon.

The Office for National Statistics (ONS) has recently published the data for public sector finances for the Financial Year ended in April. This shows a deficit of £76 billion, even though George Osborne (in)famously claimed he would eliminate the deficit in the previous year.

An examination of these data shows how the austerity policy has failed in its stated objective of deficit-reduction. More importantly analysis shows how the Labour plan initiated by Jeremy Corbyn and John McDonnell can regenerate the economy and thereby end the crisis in government finances.

Deficits matter

In the first instance it is important to state why public sector finances matter as there are some, even among progressive economists, who seem to believe that large scale deficits are of no consequence, or should even be permanently embraced

Deficits matter because they are a tax or lien on the public sector by the private financial sector via the bond market. So for example, because of the current crisis government interest payments have remained exceptionally low and are effectively unchanged since before the crisis at just over £30 billion per annum. At some point interest rates should recover to pre-crisis levels. Only if there is a permanent crisis will interest rates remain unaltered. Pre-crisis interest rates combined with the current trebling of the level of Government debt would see interest payments soar. These are funds that could be used for productive investment or in providing government services. Instead, there would be increased payments by governments to the financial sector which is the principal source of the outsized growth of the financial sector (pdf), which is frequently but mistakenly described as ‘financialisation’.

Outside exceptional periods, routinely borrowing via the bond market is justified only if the return to the government is greater than the initial outlay, which can only occur via investment. Under these conditions, the borrowing is used to grow the economy and, far from leading to an outsized financial sector reduces its relative weight in the economy because the productive sectors grow more rapidly led by public investment.

Osborne’s track record

To date the progress in eliminating the deficit has been painfully slow. The Tory-led Coalition came into office in May 2010, almost coinciding with the beginning of the new Financial Year. As most Government spending and revenue is determined by policies and economic trends from the preceding year, the more accurate starting-point to gauge the effect of austerity policies should be the total deficit in 2010/11, which was £137 billion. As noted above, the deficit at the end of FY 2015/16 was £76 billion. Far from eliminating the deficit in 5 years, Osborne has not even halved it.

Yet contrary to the claims of the extreme right, there have been very substantial cuts in public spending. As a proportion of GDP public sector spending has fallen from 43.9% of GDP to 38.2% in 2015/16. In relative terms this is a decline of 12% while the population has increased by 3.55% over the same period. Austerity is real.

Even so, because the economy has grown modestly and there has been inflation, the nominal level of public spending has increased from £681 billion to £716 billion. It is extremely difficult to reduce the deficit by cuts. They have to be on an enormous and devastating scale, like Greece, to achieve even very modest outcomes.

The principal factor which has led to modest deficit reduction in the UK is modest economic growth. While nominal Government outlays have risen by £35 billion to £716 billion, over the same period Government revenues have risen from £577 billion to £682 billion. If the OBR estimates of outlays and receipts are presented in real terms, adjusted for inflation the same trends are evident. Outlays have risen by £11 billion in real terms while receipts have risen by £62 billion. It is growth, not austerity which has produced deficit reduction.


Austerity and the deficit

Under Osborne, and supported by the entire Tory parliamentary party, the minimal reduction in the deficit has only occurred via growing Government receipts, which is a product of economic growth. The reason that progress has been so slow is that growth itself has been too weak.

This weakness of economic activity is a product of austerity policies. Although the cuts to investment are the least visible cuts of all, they are the most damaging to the living standards of the population over the medium-term precisely because investment raises the level of GDP. 

The most direct effect of this slow growth is on the Government current account, not on the capital account itself. This is because growth increases all types of tax revenues as more people are in better-paid jobs. In addition Government outlays fall for the same reason as unemployment benefits fall along with social protection payments for the low paid. 

The cut in the level of Government investment has produced a ‘saving’ of £16 billion in the most recent Financial Year compared to the peak level during the crisis. However the cumulative effect over 6 years of continuous cuts to investment has been to reduce the capital stock by £50 billion compared to what would have been the case if investment had been maintained at previous levels.

The direct effect of the cuts to investment on the current account includes two factors. First is the lower level of GDP simply by reducing investment, which is £16 billion. But fixed investment constitutes additions to the net capital stock, what used to familiarly be known as the means of production and the cumulative reduction under the Tories has been £50 billion. Secondly, therefore, it is also necessary to calculate the loss in production arising from this reduction in the net capital stock.
One way of estimating this loss of output is by using the Incremental Output Capital Ratio (IOCR). This is the measure of the level of the additional capital stock required to increase output by 1 unit a given year. It is calculated by dividing the capital stock by the level of annual Gross Value Added.  

According to the Office for National Statistics (ONS) the total IOCR for the net capital stock is 2.6. This means that to increase output by £1 billion in a single year it is necessary to increase the capital stock by £2.6 billion. Other estimates put the IOCR much higher, but as this is the official estimate, it will be accepted for now in the calculations below.

The reduction in the net capital stock arising from the Government’s cuts to investment amounts to £50 billion over 6 years, as noted above. If the IOCR is 2.6 then this reduction in the net capital stock reduces output in the latest year by £19 billion (50 ÷ 2.6).

Therefore the total reduction in output in the latest year is the sum of the reduction in investment (£16 billion) plus the cutback in output arising from the reduction in investment (£19 Billion). The combined effect of these two in the latest year is to reduce GDP by £35 billion. A ‘saving’ of £16 billion in Government investment has led to a total reduction in output of £35 billion in the same year.

The champions of austerity, including Osborne himself rarely talk about the actual cuts to investment that have been made by successive Tory Governments precisely for the reason that they are almost impossible to justify within any reputable economic framework. 

Fiscal impact is on the current account

As we have already noted a reduction in the level of GDP is the main cause of the fiscal deficit, while moderately higher growth has led to a moderate reduction in the deficit. It is the policy of cutting investment which is the primary cause of ongoing economic weakness and consequent inability to eliminate the deficit.

The effect of changes in GDP to changes in Government finances has been analysed previously by the UK Treasury and cited previously by SEB. Public finances and the cycle (UK Treasury Working Paper Number 5) estimates that for every £1 change in economic output, Government finances benefit by £0.75. 50 pence of that improvement arises from increased taxation revenues and 25 pence derives from automatically lower outlays. 

This is the ‘automatic stabilisers’ working in reverse; just as Government finances deteriorate in a slowdown they automatically improve in an upturn. It should be noted that the entirety of this improvement is registered in the current account in terms of both day-to-day revenues and outlays.

Returning to the current example a cut of £16 billion in Government investment has led to a reduction in GDP of £35 billion. But this also has a negative impact on the Government current account of approximately £27 billion (35 X 0.75). 

So, using official estimates, a cut of £16 billion in investment has led to a deterioration in Government finances of £27 billion, a net deterioration of £11 billion. All of this deterioration is registered in the Government’s current account, which is why it proves so intractable. Any actual deficit reduction is the combined product draconian cuts to public services, higher tax rates and very modest growth.

There are differing estimates of the ICOR for the UK economy, some much higher that the ONS estimate. This would have the statistical effect of limiting both the damage to growth and the negative impact on Government finances as a result, and cannot be dismissed. But in this piece there has been no attempt to include the spillover or ‘induced’ effects of Government investment on private sector investment, which would be an offsetting factor even if the direct damage to the economy and the public finances is overstated using official ICOR estimates. An illustration of these induced effects would be, say, if the public sector were to engage in a major house building programme then this might induce private brick makers or other producers of inputs to increase their investment.

It is easy to set the damaging effects of austerity into reverse. Jeremy Corbyn and John McDonnell have emphasized repeatedly the centrality of investment to their economic programme of regenerating the economy. For this reason, they stress that they will borrow for investment. This is exactly correct. There should be no confused or silly allegations that this is an austerity-lite programme, or similar. As shown above, their planned reduction in the current deficit naturally follows from a significant increase in public sector investment.

Staring in to the future by looking at Japan’s past

Staring in to the future by looking at Japan’s past
By Michael Burke

The G7 meeting in Tokyo ended inconclusively, with no agreement on how to lift the advanced industrialised economies out of stagnation. The venue was appropriate. It used to be commonplace to talk of a Japanese ‘lost decade’ yet the recession that generally began in the G7 and elsewhere in 2008 is now 8 years old. Without any programme to end the crisis, Western governments are following the Japanese path, with a repeat too of the failed policies of successive Japanese governments.

In reality is there has now been a lost generation in Japan. The Japanese economy has effectively stagnated for 25 years. Since the stock market and property bubbles burst in 1989, Japan’s real GDP growth has on average been well under 1% per annum. In nominal terms the economy is substantially smaller now than it was in 1997 as deflation has also taken hold of the economy, that is persistent falls in the price level.

The source of the Japanese crisis is the slump in investment. In 1990 the proportion of GDP devoted to investment (Gross Fixed Capital Formation) was 29.7%. By 2014 it had fallen to 20.3%. While GDP as a whole has crawled along since the bubbles burst, investment has fallen outright, as shown in Fig.1 below.

Fig.1 Japan Real GDP and GFCF

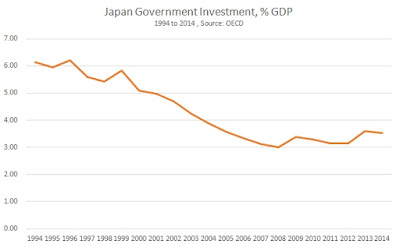
Yet bizarrely this has not prevented the growth of a cottage industry devoted to claims that the Japanese crisis is based on over-investment (pdf). Even more extreme is the notion that it is excessive investment by the Japanese public sector which has caused the crisis, or at least has been useless in counter-acting it. This reaches ludicrous proportions with anecdotal evidence about ‘bridges to nowhere’ substituting for economic analysis. This propaganda against public sector investment obscures a central fact- that Japan’s public sector investment, like investment as a whole, has been cut and is contributory factor in the investment-led downturn (Fig.2).

Fig.2 Japan Government GFCF as Proportion of GDP
Yet there has been no shortage of ‘stimulus packages’ by successive right-wing Japanese governments, including by the current one under Abe. One estimate is that these combined stimulus packages during the crisis amount to Yen75 trillion, well over 15% of current GDP.

However, these packages typically took the form of a stimulus to consumption. Where there was any focus on increasing investment this took the form of incentives, subsidies and outright bribes to the private sector, especially to the construction sector which is one of the main funders of the LDP and in whose interests it serves. As noted above, government investment was cut. But the private sector does not consider that increasing investment is in its own interests, which would be to increase profits.

Subsequently, these packages have been supplemented by a series of apparently ground-breaking policies including money-creation, inflation-targeting, deregulation, and currency devaluation. None of this has led a to a revival of investment. Therefore the crisis is unabated.

Could it happen here?

The Western advanced industrialised economies have nearly had a lost decade of their own, from 2008 to 2015. In all cases their growth has been weaker than the initial period of Japan’s lost decade from 1990 onwards which did not begin with outright recession. This is shown in Table 1 below.

Table 1 Selected Economies Real GDP Growth 2008 to 2015, % (national currency basis)
Source: OECD, author’s calculations
The Japanese economy did not first contract until 1998. Instead, the burst bubbles led to a sharp deceleration in the growth of GDP. The investment decline began much earlier, in 1992. For a time, the Japanese economy was able to continue growing by drawing on the fruits of previous high levels of investment.
 
The Western advanced industrialised economies, primarily the US and EU (as well as the UK) had no such luxury. They each had relatively low levels of investment before the financial crash. Compared to Japan’s investment/GDP rate of 29.7% prior to its crash, the US rate was much lower. US investment as a proportion of GDP peaked at 22.5% in 2005. For the EU (28 countries) the same peak was reached later, in 2007, confirming that the US was the source of the global Great Recession. The UK is a long-term low-investment economy and its investment rate peaked at 18.3% of GDP in 2007. 

It should be noted that in all cases the fall in investment preceded the decline in GDP, often by some years. Falling investment in all cases was therefore the main factor driving recession, led by the fall in US investment.

There is no indication to date that the industrialised economies either individually or as a group are correcting this main force driving the Great Recession and the subsequent Great Stagnation. On the contrary, in all cases the proportion of GDP devoted to investment has failed to recovery its pre-recession peak (Fig.3). Even this picture may be flattering as indications around the turn of this year were that investment is once more weakening.

 
Fig.3 Investment as Proportion of GDP in the Advanced Industrialised Countries
The G7 is considering many of the same failed options as Japan, or has already implemented some of them. It is a myth that Japan has tried increased public investment and failed. Factually, the opposite is the case. Japan cut public investment in the crisis, which deepened it. In order to get itself out of crisis the G7 would need to do the opposite by increasing public investment.