Uncategorized

The myth of Japan’s lost generation – and lessons yet to be learnt

By Tom O’Leary

Japan remains an important economy, the third largest in the world behind China and the US. If the EU Single Market is considered as a single economy it is the fourth largest in the world, although considerably smaller than each of these.

But it is a much less important economy than it used to be.  A period of extraordinary growth in real GDP in the post-War period gave way to recession and then virtually complete stagnation from 1990 onwards. From 1950 to 1990 the Japanese economy increased by over 13 times, much faster than the world economy (Angus Maddison data). But in the 28 years since the Japanese economy has expanded by less than a third (OECD data).

In 1990 Japan accounted for 8.6% of world GDP (Maddison). By 2018 this had fallen to 4% of world GDP (World Bank). This period of economic stagnation was first known as ‘Japan’s lost decade’. But it has dragged on to become the ‘lost generation’.

This period bears closer scrutiny, being the most recent period when an advanced industrialised country stagnated over such a prolonged period, not least because the G7 economies as a whole have been effectively stagnating since the crash of 2008.

The myth of Japanese investment

One of the abiding myths about the period of the Japanese crisis from 1990 onwards is that the government tried to revive the economy with a sharp increase in public works spending.  It is further frequently asserted that the governments were so useless that it mainly built ‘bridges to nowhere’ and that they eventually ran out of money.  It is also asserted that China’s public works investment will go the same way, and that no government in the West should be so foolish to emulate it now, and that the Corbyn/McDonnell investment programme is therefore bound to fail too. 

This Thatcherite morality tale is very widely repeated. But it is completely untrue.

What is true is that the Japanese governments frequently announced large new public works spending, often with great fanfare. But it is not true that they increased public sector investment.

Chart 1. below shows both Japanese total Gross Fixed Capital Formation (GFCF) as a percentage of GDP, as well as the private sector’s GFCF as a percentage of GDP.  There is a clear downtrend trend in total Investment, or GFCF.

Chart 1.

The decline in the contribution of Investment to GDP is exactly as would be expected in a period of outright stagnation, given the decisive contribution of Investment to GDP growth.   In 1990 (not shown in the chart) total Japanese GFCF amounted to just over 34% of GDP.  This was not massively below the post-World War II peak of 38.7% in 1973.  But by 2010 total GFCF had fallen to just 21.3% of GDP. From accounting for just over a third of Japanese GDP, GFCF slipped to little more one-fifth of GDP and has not recovered fully since that time.

To be clear, this is quite separate from the Consumption of the Japanese public sector which did rise sharply in response to the crisis. This is shown in Chart 2. Below. Government Consumption rose throughout most of the crisis period, at least until 2010. But increased Consumption cannot sustainably lift production because it provides no new means of production. That requires Investment to create new productive capacity. Put another way, attempting to use Consumption to drive GDP higher over a sustained period will end in failure on both counts.

Chart 2. Japanese Government Consumption, % GDP

Returning to Chart 1 once more, it should be noted that the decline in Investment was not driven solely by the private sector. In 1994 (the earliest available date for the disaggregated private sector data), private sector GFCF accounted for 20.4% of GDP.   By 2015 (latest available data) this had slipped to 18.3% of GDP.

This is highlighted in Chart 3. below.  This shows the calculated level of general government GFCF as a percentage of GDP, arrived at by subtracting private sector GDP from the total GFCF.

Chart 3.  Japan General Government GFCF as % of GDP

Over the period general government GFCF as a percentage of GDP fell from 9.1% in both 1994 and 1996 to a low-point of 4.8% of GDP in 2007 and 2008. It has only recovered to 5.5% in 2015. Therefore the total loss in terms of public sector Investment has been 3.6% of GDP, while the total cumulative loss in private sector Investment has been 2% of GDP over the same period.

Far from Japanese government assertions, echoed by a wide array of analysts and pundits, that public Investment was increased but it proved useless in reviving the economy, the opposite is the case. The Japanese public sector slashed its own Investment, almost cutting it in half.  The cut in public sector Investment was mainly responsible for the decline in total Investment.

This cut in public Investment was much greater than the simultaneous cut in private sector Investment – despite being a much smaller initial value.  Throughout the process, it was the fall in public sector Investment which also led the way, and private sector Investment did not reach its own low-point until three years after the public sector (spurred on by the fall in the level of profits in 1992, which have never properly recovered).

A public investment diversion

As noted above, the change in Japanese public Investment was a fall of 4.3% of GDP from its 1994 (and 1996) level to its low-point in 2007. Even the most strongly growing economies would struggle if any factor was reduced by 4% of GDP.  But the decisive role of Investment in accounting for GDP growth means that slump and stagnation was effectively unavoidable.

What caused the Japanese public sector to choke off Investment, slow the economy to stagnation and lead the Japanese private sector into cutting its own Investment? According to US Treasury data (pdf) Asian holdings of US Treasuries (government bonds) rose from $84 billion in 1984 to $283 billion in 1989 and upwards to $418 billion in 1994.  As the US Treasury notes, these are overwhelmingly held by Japan.

Low levels of Asian (mainly Japanese) US Treasuries’ holdings in 1984 ballooned fivefold in just 10 years.  In relation to Japanese GDP, total Asian holdings were less than 1% in 1984 and approximately 10% in 1994, even taking into account the surge in the value of the Yen over the same period.

That surge in the Yen did not occur simply as a result of market mechanisms. In 1985 the Reagan Administration, struggling with the accumulated debt of the Viet Nam war and recession of the early 1980s, insisted that other countries, Japan, West Germany, France and Britain sell US Dollars to engineer a depreciation which would make US industry more competitive. The US allies were also obliged to cut their own Investment and increase Consumption, partly to boost US exports. This agreement was formalised in the Plaza Accord of 1985. It also allowed the US to maintain very large budget deficits as it pursued the Cold War arms race to destruction.

The effect on Japan and Japanese industry was profound and dramatic. In February 1985 there were 260 Japanese Yen to the US Dollar but by 1987 the exchange rate had fallen to 121. This was excruciating for Japanese industry, which now struggled to compete internationally because of this more-than-doubling in the exchange rate value of the Yen. 

The Japanese government in particular was obliged to sharply increase its purchases of US Treasuries, under threat of hollowing out Japanese industry via the exchange rate. This demand was later reinforced under the separate Louvre Accord. The author of the policy was the US administration under Reagan.

The widely-repeated claim that Japanese public Investment failed to rescue the Japanese economy is no more true for repetition. The opposite is the case. The cut to public Investment was decisive in causing the slump, being both earlier and deeper than the cut in private Investment.  Instead, the Japanese government followed US demands to ‘stimulate demand’, that is increase Consumption in its own economy.

Both of these policies, the cut in Japan’s public Investment and the increase in public Consumption were the effects of the US measures to support its own economy, fund its budget deficit and hugely increase its military spending.  But it has hobbled the Japanese economy for almost three decades now.

Currently, but for different reasons the US is once more looking to overseas sources of capital to maintain current US living standards and increase spending.  How it is attempting to engineer that inflow this time around will be examined in a follow-up piece.

Only Labour will end austerity – the Tories plan a whole new offensive

By Tom O’Leary

There are widespread claims that the government is ending austerity. The reality is that it is engaged in a pre-election spending spree, just as Osborne and Cameron did in 2014.  Subsequently, it should be clear that the small-state right-wing ideologues in Johnson’s Cabinet intend to use a No Deal Brexit as a platform for another huge assault on living standards, workers’ rights and the public sector. They also have no intention of tackling the climate crisis. It is only the Labour Party of Jeremy Corbyn which has a plan to end austerity, with clear commitments to increase public investment, restore public services and tackle climate change.

What are the Tories promising?

The government and their faithful supporters in the press are touting the real terms increase in both current spending and in public investment. Current spending is set to rise by 2.0% in real terms and public investment set to rise 5.6% on the same basis.

But the first point to note is that this is a promise almost certainly for the next parliament as an election now seems inevitable.  If the Tories win the new government will not be bound by the promise of the last one.  It is also a one-year promise, to get through an election. The widespread consensus is the government departments and all their agencies require a minimum of three years funding so that they can plan ahead. 

Claims that this is the biggest spending spree for decades are false. This plan is similar to the Osborne/Cameron one in 2014/15.  Under them public sector gross investment was increased 8.7% in real terms in 2014/15 compared to the previous financial year, in time for the 2015 general election. The rise in public sector current spending was far more modest, perhaps because Osborne understood the importance of investment to spur growth.  But if we take the whole of increased government outlays together, both consumption and investment in Total Managed Expenditure, the current plan is to raise TME by 2.4% in real terms, while Osborne/Cameron increased TME by 2.3% on the same basis.

The cynicism of the Tories was such that these totals were actually cut in real terms once they had won the 2015 election. There is no reason to suppose that the current Tory Cabinet, which occupies a political position even further to the right, will be any different.

What are the Tories going to do?

The current Cabinet is packed with right wing ideologues. The Health Secretary, who claims to be more moderate than his colleagues, argues for the accelerated privatisation of the NHS, and is putting that into practiceAcademisation is the main weapon in the privatising of secondary education. The teaching union the NEU has highlighted the UK’s role in the privatisation of education globally, including through the aid budget (pdf). Boris Johnson is himself an advocate of privatisation and his Chancellor claims to be an avid fan of the neoliberal guru Ayn Rand.

But the Tory perspective is not determined by the outlook of its key members. It is the objective conditions that will determine their choices. The British economy remains in a crisis. The austerity project has failed it its own terms – which is the transfer of incomes from workers and the poor to business and the rich in order to revive a business-led expansion of the economy.

The transfer of income has been real, and real wages have fallen and the social surplus has been redirected from social security to tax cuts. But the profit share has not risen. In 2008 the Gross Operating Surplus of firms was 39.3% of GDP. In 2018 it had fallen to 37.9% of GDP. Profitability has not revived.

As a result, investment has not revived either.  In 2008 it was plummeting and accounted for just 17.2% of GDP. In 2018 it was 16.9%.

For a sustainable business-led expansion, a decisive defeat of the working class and its allies is required. That has not been achieved. Now, the extremists in the Tory Cabinet, orchestrated by the Trump administration, believe that crashing out with a No Deal Brexit is the opportunity they need to impose that decisive defeat.

This will entail not just a fall in living standards, and loss of well-paid jobs in advanced manufacturing sectors such as cars and pharmaceuticals. But, as British-based businesses will be obliged to compete more directly with US rivals, they will in turn demand far lower union rights, health and safety standards, lower pensions and other entitlements. There will be an Americanisation of the British working conditions.

The Corbyn alternative

The scope of the Corbyn-McDonnell project makes the Tories’ pre-election bribe look like the chicken feed it is. Using the same TME measure, which combines both government current spending and public investment, the Labour plan increases it by 3.4% of GDP. Crucially, this is not a one-off, but a sustained increase over each and every year of the next 5-year parliament.

This is about 7 times what Johnson’s Cabinet promises. And it does not include the additional effects of the National Investment Bank on raising investment, nor does it include the probability of some businesses being obliged to increase their own investment, to provide the inputs for the increased investment from the public sector.

The Corbyn-McDonnell plan is a sustained effort to raise the growth rate of the economy, contribute to the global effort to tackling climate change and genuinely ending austerity.

What the Tories plan is not an end of austerity. Instead they plan a whole new attack on workers and the poor.

I have witnessed three coups – power not only protest is needed to stop them

By John Ross

I have witnessed three coups and attempted coups – two in Russia and one in Britain. One was ended politically, one with tanks, the present coup attempt is still not settled. There are decisive lessons on how to deal with them which precisely apply to the present attempted coup by Johnson.

These three coups were in March 1993 in Russia – ended by political means, October 1993 in Russia – ended by tanks. August 2019 in Britain – which will be ended by political means. But each had the same key lessons.

To summarise the events in these three coups each of which I witnessed first hand.

  • In March 1993 Yeltsin attempted to overthrow the Russian constitution, in order to concentrate power in his hands and continue the implementation of economic shock therapy. He was successfully defeated in this by the Russian Congress of People’s Deputies and ministers in the government. However, having defeated the coup, the Congress of People’s Deputies then made the disastrous mistake of compromising with Yeltsin to hold a referendum, in which Yeltsin used his control of the courts and electoral fraud to determine the outcome of. This gave to Yeltsin the political initiative to prepare the coup of October 1993.
  • In the October 1993 coup Yeltsin unconstitutionally declared the dissolution of the Congress of People’s Deputies – the highest authority of the Russian state. This was opposed by massive street mobilisations of Moscow’s population. Yeltsin then ordered the Parliament to be surrounded by armed police which were under his control. The armed police were prevented from taking control of the Parliament by armed resistance by numerous people inside the Parliament building, some with sub-machine guns and similar weapons. The police action was simultaneously opposed by even larger mobilisations of Moscow’s population until the police blockade of the Parliament was broken after several days – the armed police had been demoralised by the steadfast opposition of the Moscow population. But then, instead of consolidating this victory, the leadership of the Parliament made the disastrous decision to launch an attempt to take control of the main television station. Pro-government armed forces stationed there, who had not been subject to popular pressure, obeyed orders to open fire on the crowd carrying out a massacre. Following that the Parliament was attacked by heavy weapons, notably tanks, which the defenders of the Parliament were not able to resist. Yeltsin therefore was successful in this coup d’etat.
  • In August 2019 Johnson attempted to force through a No Deal Brexit through suspending Parliament. The outcome of this struggle remains to be determined.

Each of these coups, however, has the same key lessons which totally apply to Johnson’s attempted coup.

In a coup the issue of state power is what is ultimately decisive – not just protest

The first key lesson is that in confronting a coup it is the issue of state power which is decisive – everything else has to focus on this or it is ineffectual. Everyone who opposes the coup is on the right side and an ally, but there is confusion. As an example on this at present, for example in Britain faced with Johnson’s coup various MPs have proposed so called ‘alternative Parliaments’, MPs occupying Parliament if it is suspended etc. These are beside the point and are in reality to accept Johnson’s coup. MPs have to do something much more powerfu and important than this – simply vote legislation that there will be no prorogation of Parliament, and then, in the present situation, there will be no prorogation and Johnson’s coup will be blocked for the reasons clearly outlined below.

Similarly, writers such as Owen Jones and Paul Mason have called for ‘protests’. Momentum has said it will block streets and bridges. Mason has even made a supposed arithmetic calculation on the percentage of the population that has to be involved in protests for them to stop the government: ‘What we need now is a mass peaceful movement of civil disobedience. Protest theory tells us that if around 4 percent of the population simply refuses to comply with the powers that be, we win.’

But Mason’s look at the possible steps does not even mention Parliament legally blocking its prorogation: ‘The parliamentary options are now limited. Phase one is for MPs to take control of the parliamentary agenda… Phase two – being prepared right now – is to publish legislation stopping No Deal. Phase three is preventing Johnson and his allies from filibustering or sabotaging that legislation.’ Mason declares: ‘Parliamentary options to protect democracy are limited, but we can use mass civil disobedience to create a situation politically unbearable for the Tories.’

The truth is the exact opposite. Protests will not stop Johnson’s coup, only action by the state will – which in the present situation (not all situations) means laws passed by Parliament.

Protests must demand changing the law

The largest possible popular protests are indeed very necessary. They will influence the political dynamics. But in defeating a coup protests cannot be sufficient to decide it. Bluntly, demonstrations so far in Britain are very small compared to the enormous ones in Moscow to confront Yeltsin’s  coup of October 1993. But protest demonstrations will not stop a coup – only something which affects the state power will.

In Moscow there were there truly gigantic demonstrations against Yeltsin’s October 1993 coup, there were hundreds of armed people many of whom were willing to die, and a significant number of whom did die, to defend the Russian Parliament. But they were simply overwhelmed by the greater power of the state – in this case by tanks.

In Britain neither people with machine guns nor tanks will be involved in the fight to block Johnson’s coup. But the state, whether using the police, the riot police, or even the armed forces if necessary [which won’t be in the present situation] can overwhelm by force any protests which challenge its power. The strongest possible protests are necessary to put pressure on the state power, and to determine the political situation, but they cannot defeat the state power – which in the present situation will be expressed in the law.

These decisive points are not meant in any sectarian sense. To use the Chinese formula, because it is the most precise, it is necessary to carefully distinguish between contradictions among the people and contradictions between the people and the enemy. The ‘enemy’ in the present situation are all those who support Johnson’s coup, the ‘people’ are all those who oppose it. MPs proposing occupying parliament/alternative parliaments etc are unequivocally against Johnson’s coup, part of the ‘people’. It is necessary to stand with them shoulder to shoulder in fighting this coup. But because they do not understand the issue of state power, which is what is decisive in a coup, they have tactics for fighting against it which are not sufficiently effective. Therefore, it is necessary to show the conditions which can stop the coup – which in the present circumstances can only be legal action by Parliament. Protests are absolutely necessary and important, but they must aim at securing that legal change.

Why preventing proroguing Parliament is vital

Blocking Johnson’s No Deal Brexit is certainly vital but it is also absolutely crucial to prevent the proroguing of Parliament – which is entirely possible legally. Johnson cannot be trusted on anything. Under the British constitution Parliament is the supreme authority – but if Parliament is not in session the highest authority will be the government and the Prime Minister. For example, once Parliament is prorogued there is nothing legally which prevents Johnson advising the Queen to extend the prorogation beyond 31 October, the date for Brexit. No assurance by Johnson/Cummings this will not be done can be relied upon one inch – they have already shown they are prepared to disregard any of their previous statements.

Three government ministers – Johnson in his interview with the Sunday Times, Gove and Gavin Williamson – have already taken the unprecedented step of saying that the government will not necessarily obey a law passed by Parliament (which could include advising the Queen not to sign a law) – an unprecedented violation of Britain’s constitution. Any such step by the government would normally be countered by a vote of No Confidence and removing the Prime Minister with a replacement who would carry out the law including advising the Queen not to refuse to sign Acts of Parliament or prorogue Parliament. But if Parliament is not sitting, if it has been prorogued, this cannot be done. There would, therefore, be no way to overturn the advice given to the Queen.

If legislation is passed Johnson will set about ‘discovering’ ‘loopholes’ in it.

There are also numerous other steps which Johnson/Cummings could doubtless dream up.

In short to allow Parliament to be prorogued would create an ultra-dangerous situation removing control of the situation.

Therefore, while measures to prevent a No Deal Brexit must certainly be passed by the House of Commons over this coming week it is also absolutely essential to pass a law blocking the proroguing of Parliament. It is imperative that, in addition to any measures on No Deal, Parliament remains sitting – that is it is not prorogued. This can be done by Parliament passing short legislation preventing it being prorogued in the present situation.

Defeating a coup

Defeating a coup means starting off by understanding that the outcome of this will be determined by state power, and determining this means a precise analysis of the relation of forces.

The first key step was been taken by Jeremy Corbyn and the joint statement by opposition parties when the said they did not accept the prorogation of Parliament. For reasons outlined below there has to be a laser like focus on maintaining this.

On 28 August Jeremy Corbyn stated:  ‘Suspending Parliament is not acceptable, its not on. What the Prime Minister is doing is a sort of smash and grab on our democracy in order to force through a No Deal Brexit… So when Parliament does meet, on his timetable very briefly next week, the first thing we’ll do is to attempt legislation to prevent him doing what he’s doing and second we’ll challenge him with a motion of confidence at some point.’

On 29 August Jeremy Corbyn repeated: ‘We’re back in Parliament on Tuesday  to challenge Boris Johnson on what I think is a smash and grab raid against our democracy where he’s trying to suspend Parliament in order to prevent a serious discussion and a serious debate the prevent a No Deal Brexit.

‘What we’re going to do is try to politically stop him on Tuesday with a Parliament process in order to legislate to prevent a No Deal Brexit and also to prevent him shutting down Parliament during  this utterly crucial period.’

Later on 29 August there was the joint statement by the Labour Party, SNP, Lib Dems, Plaid Cymru, For Change Now, and the Green Party.

‘We condemn the undemocratic actions of Boris Johnson following his suspension of Parliament until 14 October….

‘In our view there is a majority in the House of Commons that does not support this prorogation, and we demand that the Prime Minister reverses this decision immediately or allows MPs to vote on whether there should be one.’

This statement had only one ambiguity which should be removed. It is not necessary for Johnson to ‘allow’ MPs to vote on prorogation. Parliament is supreme. It can decide, but this is just an ambiguity in the statement not a wrong position.

Reliance cannot be placed on the courts. In Russia in March 1993 one of the disastrous mistakes made by Congress of People’s Deputies was to attempt to compromise with Yeltsin by stating that a referendum supporting him had to receive support of 50% of the electorate and not just 50% of those voting. Yeltsin used his control of the courts to overrule this.

Parliament, the law and the monarchy

In Britain at present, as Chris Daw QC reminds us: ‘The first thing they teach in law school – The Queen-in-Parliament is sovereign. Not the Government, not the Prime Minister.’  That means it is the action by Parliament which is decisive because it determines the law. Protests are extremely important but will only prevail if they help influence the decisions of Parliament.

As for the Queen, naturally socialists have no illusions in the monarchy. If what was threatened was the end of capitalism she might well act illegally and outside Parliament. But Brexit, either way, will not end capitalism and in these circumstances she will act in a way to strategically preserve the monarchy. And that means not going outside the law set by Parliament because to do so would for the first time endanger the monarchy.

The decisive issue is therefore that Parliament pass legislation preventing itself being prorogued. That legislation is the key issue, not challenges in court. If Parliament has not passed legislation to stop itself being prorogued the Queen will act on the Prime Minister’s advice as she has done so far. But if Parliament passes legislation she will act in accord with that law in order to preserve the monarchy from strategic threat. And if a Prime Minister advises her not to sign an Act of Parliament that Prime Minister can be removed, and the advise reversed, by Parliament – but only if Parliament is sitting!

Johnson cannot be trusted – therefore Parliament must remain in session

Jeremy Corbyn’s statements on 28 and 29 August, and the joint statement by opposition parties on 29 August, were spot on regarding the impact of a coup. But a broader picture is that a number of people cannot rapidly adjust to standing up to power and they accept the framework of the coup while ‘protesting’ about it. This is inevitable because as Marx says the ruling ideas of society are the ideas of the ruling class. It takes a serious struggle for people to break with obeying authority. Therefore, the first reaction of many people to a coup is to accept its framework and only attempt to take measures within its framework.

This was seen in March 1993 and October 1993 in Russia when Yeltsin, with the full weight of the US behind him, and with US advisers, acted illegally, rapidly, and decisively.

In contrast was the fatal mistake made by the Russian Congress of People’s Deputies in March 1993. By the time the Congress had finished its first session the coup had been decisively defeated. The head of the so called ‘power ministries’, that is the forces of repression, refused to carry out Yeltsin’s unconstitutional action. The Congress of People’s Deputies, the supreme constitutional authority of Russia, not only did not accept Yeltsin’s unconstitutional steps but voted by 60% for the impeachment of Yeltsin – only 7% short of the necessary two thirds majority to remove him. Yeltsin coup attempt was stopped dead in its tracks.

But instead of simply consolidating Yeltsin’s defeat, standing up to Yeltsin having blocked his coup, the Congress instead set about seeking a compromise with Yeltsin – agreeing to a referendum but attempting to set its own conditions. Naturally Yeltsin, in contrast, had no intention of ‘compromise’. As soon as the Congress of People’s Deputies was not in session Yeltsin used his control of the courts to overturn the conditions set by the Congress and then used his control of the electoral system to falsify the referendum.

The present situation in Britain shows a similar dynamic. Johnson is acting in a centralised, illegal and decisive way.  Talk of protests, alternative parliaments and so on will not stop such actions. Passing of a law which decides that Parliament cannot be prorogued in the present period is the decisive measure. This is vital to pass alongside legislation blocking a No Deal Brexit.

The fate of Parliament lies in the hands of the House of Commons – as this House of Lords will not support Johnson on prorogation. If the House of Commons immediately passes legislation, as soon as it sits, that Parliament cannot be prorogued at present Johnson’s will be defeated. If the House of Commons does not pass such a law Johnson’s attack will roll on.

If Parliament is prorogued it will only be due to the wrong judgement or cowardice of MPs. The fate of Parliament lies entirely in its own hands not those of Johnson. That is the lesson of three coups.

‘Boosterism’ and economics, or exposing the lies of Boris Johnson

By Tom O’Leary

All good jokes summarise or tell us something new about our society, or the times we live in, or about human nature. There is a very old, and very bad joke (repeated by Margaret Thatcher, among others) that, ‘The problem with socialism is that you run out of other people’s money’. It is a bad joke because it relies on a number of falsehoods.

There never has been a genuinely socialist government in Britain, and the largest and most famous economic crashes in this country have nearly all taken place under Tory or Tory-led governments. These were the depression of the 1930s and Churchill’s return to the gold standard, the Barber boom of the early 1970s, the Lawson boom of late 1980s and the imposition of austerity in 2010. The sole exception to this pattern was the crash under New Labour in 2008, which had adopted the Tory mantras of privatisations, PFI and bank deregulation.

Now, the new Prime Minister has adopted an economic policy he describes as ‘boosterism’. Boris Johnson as PM, or even as an architect of economic policy is itself a joke in poor taste. But the definition of boosterism under Johnson is simply promising anything in order to gain popularity.

This is important to grasp, as Johnson is not simply continuing Cameron/Osborne austerity. First, he has to get elected and is willing to scatter promises to achieve that.

Boris Johnson has form in this area. There is no garden bridge over the Thames, there is no ‘Boris Island’ airport, firefighter numbers were reduced and fire stations closed despite pledges to the contrary, and police cuts were only reversed when it threatened his re-election. The pledges were false, even where significant amounts of public money were spent.

Johnson’s current lies

Boris Johnson has effectively come to office after a coup against the previous Tory leadership. The electorate have not endorsed as Prime Minister, even indirectly, and pollsters have noted that his ‘bounce’ in the polls is far lower than Theresa May’s and is already fading – Labour is once again frequently marginally ahead in national opinion polls.

Under these circumstances, and leading a government which is supported by a bare majority that is the result of bribes to the DUP, Johnson does what comes naturally. He lies. He has promised:

  • £1.8 billion for the NHS. This is a tiny amount compared to what the NHS needs and it has emerged since that £1 billion is not new money, and the source of the remainder has yet to be identified
  • A total of £6.3 billion (£2.1 billion of which is new money) to prepare for No Deal Brexit, despite claiming it was a ‘million to one chance’ against happening
  • 20,000 extra police officers, which is nearly as many as the Tories have cut since 2010, but says nothing about the similar numbers of police community support officers, and police admin staff that have also been cut over the same period
  • More prison places and longer sentences, even though there are no new prisons and they would take years to build
  • Full-fibre broadband across the country by 2025 – but no plan to achieve it, not even in outline, and no suggestion of the resources it would require
  • To ‘level up’ per pupil funding in schools (which is aimed at Tory voters in the shires who complain about the greater funding for inner cities’ schools). The estimated cost for secondary schools alone is just £50 million per annum, a pittance compared the £4.6 to 5 billion needed simply to reverse Tory cuts to schools
  • A tax giveaway to the higher paid, raising the higher tax band threshold from £50,000 a year to £80,000 (which benefits someone earning close to £80,000 or more much more than the benefit to those just above £50,000). There is no indication of the cuts elsewhere, to fund this giveaway, or a justification for the higher borrowing it would entail.

Politically, his agenda is aimed squarely at his own base, ‘with law and order’ measures to the forefront. Random stop and search will certainly increase the number of black and Asian boys harassed by police, but will do virtually nothing to halt crime, as Home Office analysis shows.

Boosterism and economic fundamentals

This string of false promises, untrue claims and distortions are widely believed to be associated with a planned general election campaign around the time of the Tories’ central project of a No Deal Brexit. As No Deal itself and the likely plans of a hard right Tory Cabinet represent a double blow to living standards, this will be discussed below.

Yet, even before these two new blows to the economy and living standards, it is important to recall that the British economy is already in a crisis. The main source of this crisis is highlighted in Fig.1 below, reproduced from the Office for national Statistics (ONS). It shows that a weak recovery in business investment following the crisis of 2007 to 2008 has given way to outright stagnation and even decline. The economy has also begun to contract once more in the 2nd quarter of this year, in the recently-released preliminary data.

Chart 1. UK Business Investment

One way to illustrate how the weakness of business investment has been the main brake on growth and prosperity is by comparison. Fig.2 below shows that business investment has been far weaker than GDP growth since the beginning of the crisis. For illustration, business investment has also been far weaker than the growth in household consumption.

Chart 2. UK Real GDP, Household Consumption and Business Investment from Q4 2007 to Q1 2019

Since real Business Investment peaked in the 4th quarter of 2007 it has risen by just 3.25% to the 1st quarter of 2019. This is much weaker even than the growth in real GDP, which has risen cumulatively by 13% over the same period. In addition, it is often incorrectly asserted that the source of the crisis is the absence of ‘demand’, which is primarily Consumption. But real Household Consumption, which is the bulk of domestic demand has largely kept pace with the rise in GDP over the same period, increasing by 12.6%. In simple arithmetical terms, it is shown that the weakness of Business Investment is the main drag on UK growth.

But it is also possible to highlight this point in a more fundamental way. Consumption requires production – for most of us, even the apples we eat don’t just fall from the trees. They are commercially picked, processed, transported and sold by retailers. The main means of sustainably increasing that production is to add to the means of production through net investment, or to increase the number of hours worked.

Fig.3 below shows the growth rate in what the ONS calls the level of the capital stock (the means of production) over time, as well as changes in the net capital stock once the consumption of capital is taken into account. The consumption of capital is simply the capital that is used up in the production process, whether that is a rubber washer, a machine tool or a factory, which are each consumed or depreciated over different time periods.

Chart 3. Percentage change in growth rate of capital stock, net capital stock and capital consumption

The ONS summarises these trends as follows, “The UK’s net capital stock was estimated at £4.6 trillion at the end of 2017, increasing by 1.1% compared with 2016. Prior to the economic downturn, net capital stock increased on average by 2.0% per year, slowing to an average of 1.3% per year since 2010.”

Over the medium-term from 1997 onwards the annual growth rate of the capital stock has slowed from fractionally under 3% to just over 1%. As business is responsible for the bulk of the growth in the capital stock it is this prolonged deceleration in the growth of the means of production of the private sector that is the decisive factor in the medium-term slowdown and stagnation of the economy.

To raise the annual growth rate of the capital stock to 2% would require an additional £46 billion of fixed investment (which would itself need rise over time as this additional new capital itself depreciates).

Of course, set against this fundamental problem Boris Johnson’s ‘pledges’ of tax cuts for the rich and more spending on No Deal are simply another joke in poor taste. Failing to address this problem (unlike Labour, which promises to increase public investment) means that none of Boris Johnson’s pledges can possibly lead to economic growth or rising living standards over the medium-term. That is even without the damage from his central project, No Deal Brexit.

The threat of No Deal

A No Deal Brexit entails the severing of Britain’s close economic relationship with the EU, for the assumed benefits of a closer economic relationship with the US. But this is fool’s gold. In 2016, total UK trade with the EU (goods and services) amounted £554 billion, compared to £166 billion in total trade with the US (source, ONS).

There is no conceivable improvement in the trade relationship with the US that could even compensate for the likely fall in trade with the EU. At the same time, much of the country’s trade with other countries in the rest of the world is currently governed by trade agreements with the EU, and many of those are reluctant to offer the same terms to this country when it leaves.

More importantly, production in many sectors in the UK economy is closely linked through highly intricate supply chains to output in the EU. For many reasons, including geography these cannot be reproduced in supply chains connected with the US. Therefore any sector that has either tariff or non-tariff barriers will be faced with series of painful adjustments, including closure and relocation, with all the consequent loss of jobs.

There is too the obvious negative impact of the terms of any likely trade deal with Trump (and many of his possible successors). These range on everything from environmental standards to workers’ rights to food regulations and the accelerated privatisation of public services, including the NHS. In addition to China, Trump has already imposed tariffs and trade restrictions on neighbouring Mexico and Canada (effectively tearing up NAFTA), as well as India and the EU. This is in addition to the growing list of countries sanctioned for purely political reasons, such as Venezuela, Cuba, Iran, Syria and Russia.

But it is probably an error to assume that this government is even mildly uncomfortable with a US trade agreement that will increase fracking, sell off the NHS, reduce rights at work and allow US agri-business unregulated access to UK markets.

This is an ideologically hard right Tory Cabinet, many of whom, for example have explicitly advocated private health insurance or have financial links to it. Privatisations, fracking, ignoring the catastrophic risk of climate change and reducing workers’ rights can all contribute to an increase in labour exploitation and have the potential to boost profits.

For this government, and a small number of sectors, Trump’s demands can be seen as an opportunity, not a threat. The domestic beneficiaries of No Deal can include hedge funds and other speculative capital, private health insurers, private school owners and managers, frackers, sweatshop employers and landlords, as well as their apologists and PR agents.

For the overwhelming majority of the population a No Deal Brexit would have a very serious negative impact on living standards. It is also true of large sections of British capital. The fall in living standards has already been renewed with the fall in the pound leading to higher inflation and lowering real wages, as well as the job losses which have already begun simply from the threat of No Deal. No Deal will also reverse even the limited contribution to date of addressing the climate crisis.

Conclusion

Boris Johnson’s is a political campaign, where false promises are designed to win an election. They will do nothing to improve the economy or living standards for the vast majority.

Worse, his central project of a No Deal Brexit will deepen the economic crisis, by severing the closely inter-connected production supply chains within the EU. The replacement free trade deal with the US will only exacerbate the crisis and widen it to include policies which will add to the climate crisis, worsen public services and worker’s pay and conditions.

Labour already has the economic weapons to fight Johnson. Its fully-costed programme of measures to begin reversing austerity for the 2017 election amounts to £48.6 billion (pdf). This is massively greater than anything Johnson will ever promise, because it benefits workers and the poor the most. More importantly, as shown above, Johnson has nothing to say about raising the growth rate of the economy and living standards in a sustainable fashion. Labour does, with increased public investment and the National Investment Bank. It is also possible that Labour could build on its own successes of 2017, with additional funding for both, especially as interest rates are so low. But the defeat of No Deal is the next decisive step in Labour’s anti-austerity fight.

Why the US economy is slowing – how it will affect the trade war and China

By John Ross

The following article was written before the announcement of the latest US GDP figures, which showed the US economy slowing from an annualised 3.1% growth in the 1st quarter of 2019 to 2.1% in the 2nd quarter. This new data clearly confirms the analysis in the article. The Chinese version of this article originally appeared in Chinese in China Finance.

The Federal Reserve’s shift towards cutting interest rates

The US Federal Reserve’s sharp turn in summer 2019 towards cutting US interest rates immediately affects China and the global economy via numerous channels. But in addition to short-term effects, the reasons for the Federal Reserve’s policy change casts a clear light on the US economy’s medium- and long-term growth perspectives. Both aspects will affect China-US trade negotiations. This article therefore examines the fundamental growth trends in the US economy leading to the presidential election.

Why did the Federal Reserve make a sharp policy turn?

The Federal Reserve’s summer 2019 shift was an abrupt reversal of the Fed’s previous policy. During 2018 the Fed carried out four interest rate rises, clearly reflecting an estimation that the US economy had strong upward momentum and it was necessary to take prudent steps to head off overheating. Even as late as May 2019 Fed Chairman Powell said weak inflation was transitory – implying there was no reason to cut interest rates.

By June 2019, in contrast, the Federal Reserve press conference was universally interpreted as indicating the Fed would cut rates – the Fed funds futures market pricing in three quarter-point cuts in 2019, including 100% odds for a quarter-point cut this summer. A 0.25% rate cut was duly carried out at the July Fed meeting.

There are two interpretations of this radical policy change. The first is that it was a response to temporary non-fundamental trends in the US economy – short-term effects of the trade war, loss of momentum by US share markets etc. In that case the US economy may be anticipated to rapidly recover from such problems. The second interpretation is that the Fed was responding to much deeper trends slowing the US economy in 2019 – in which case the question becomes how deep is this slowing likely to be?

This difference overlaps with the fact that throughout the recent period two different perspectives for the US economy in 2019-20 have been put forward. The first, that of the Trump administration, argued that due to US tax cuts the US economy would accelerate in 2019. In March 2019, in its official budget forecasts, the administration projected 3.2% US GDP growth in 2019 and 3.1% in 2020 – both faster than 2018’s 2.9% and in line with President Trump’s claim that the US economy would grow at least 3% a year during his presidency.

The second perspective, held by the IMF, the present author, and others, was that the US economy would experience downward pressure in 2019. In that case, of course, the Fed’s policy shift was a response to deeper more powerful trends in the US economy.

Recent negative trends in the US economy

Recent US data is clearly in line with this second perspective. US total industrial production, including oil and gas, stalled after the end of 2018 – by May 2019 it was 0.9% below December 2018’s level. The decline in US manufacturing production, 1.5% in the same period, was sharper. In April 2019 US manufacturing production was 4.8% lower than its level more than 11 years previously in December 2007 – Trump’s policy to strongly revive US manufacturing production had failed.

Taking PMIs, the US Composite PMI was  51.5 in June 2019 – the second lowest since 2016. The US manufacturing PMI in the same month fell to its second lowest level since 2009 – 50.6… By the 1st quarter of 2019 the annualised growth of US fixed private investment had fallen from 9.9% when Trump was inaugurated to 1.5%.

President Trump demands the Fed cuts interest rates

These negative economic trends, in addition to direct effects, created strong political pressure on the Fed – President Trump launching a public campaign to force the Federal Reserve to cut US interest rates. The reasons for these attacks were clear. Opinion polls for Trump, leading to the official launching of his re-election campaign in June, were unfavourable. Leaks of his internal campaign polling showed the President had for several months been trailing Democrat Joe Biden. Recent polls showed President Trump trailing nine percent behind Democrat Bernie Sanders. Given negative poll ratings the prospects for the US economy in 2019-2020 were crucial for Trump’s re-election chances.

A recession in 2019?

Some major Western analysts believe that US economic slowing was so severe it indicated a US recession – two quarters of negative growth. For example, John Authers, Senior Bloomberg Editor for Markets, analysed under the self-explanatory headline ‘Markets Are Acting Like a Recession Is Unavoidable’:

‘would it be possible to explain what is going on in markets without making reference to the deteriorating U.S.-China trade relations? I am beginning to suspect that it would. Bond markets may be behaving as though they are bracing for something terrible to happen because traders are, indeed, scared that something terrible is going to happen.’

Quantitative analysis, however, indicates that any view the US economy will enter recession in 2019 is exaggerated. US growth in 2018 was 2.9%. Since the immediate aftermath of World War II, the largest deceleration in US GDP in one year compared to the previous one was 2.5% in 2009, under the impact of the international financial crisis.

However, in the 1st quarter of 2019 US GDP growth was 3.2%. For a recession to occur in 2019, between the 1stquarter and the 3rd quarter US GDP growth would have to fall from 3.2% to less than zero in only six months – a slowdown worse than during the greatest economic crisis for 80 years. Such a scale of economic deceleration is not indicated by domestic or international US economic imbalances.

Claims 2019 will see a US recession are therefore exaggerated, but there are clear reasons why the US economy will slow in 2019 and US growth will remain low in the medium/long term. This provides the background to Federal Reserve decisions.

Inaccurate claims by the Trump administration

To analyse accurately US economic dynamics, merely electoral propaganda claims by the Trump administration may be dismissed. Trump has claimed that ‘America’s economy is booming like never before’ but the reality is that under President Trump the US has experienced the slowest peak economic growth during any presidency since World War II. As demonstrating this casts a clear light on fundamental US economic trends, Table 1 shows peak growth under all US Presidents since World War II presented both in the way the US publicises economic growth, one quarter’s growth compared to the previous quarter presented at an annualised rate, and China’s method of comparing a quarter in one year with the same quarter in the previous year. Both show peak economic growth under Trump is lower than under every previous post-World War II US President. Taking 21st century presidents:

  • Using the US method of presenting data, peak growth under Trump of 4.2% was lower than 5.1% under Obama, George W Bush’s 7.0%, or Clinton’s 7.5%.
  • Calculated using real year on year growth, 3.2% peak growth under Trump was slower than 3.8% under Obama, 4.3% under George W Bush, and 5.3% under Clinton.

But peaks under 21st century presidents were much lower than under 20th century post-World War II US presidents. For example, peak growth under Nixon was 11.3% using the US method of presenting data. Peak post-World War II growth was under Truman at 16.7% using the US method of presenting data. Slow peak growth under Trump, of course, helps explain his relatively unfavourable position in opinion polls.

The slowing of the US economy

Turning to fundamental US economic trends, accurately analysing these requires distinguishing short-term business cycle fluctuations from medium/long term economic trends. The most accurate way to do this is to take a medium/long-term moving average of US growth – which eliminates effects of purely short-term fluctuations. Such measures show that taking either a 7, 10- or 20-year moving average gives the same fundamental result that long term US growth is slightly above 2% – a 7 year moving average shows annual average 2.3% GDP growth, a 10 year average shows 2.2%, and a 20 year average shows 2.1%.

Taking the longest-term moving average, 20 years, Figure 1 clearly shows that the fundamental trend of US economic growth in the last 50 years is significant deceleration. Annual average US growth fell from 4.4% in 1969, to 3.5% in 2002, to only 2.1% in 2019. In the last fifty years average annual US growth rate has fallen by more than half, explaining why US growth under Trump is the slowest under any US president since World War II but also showing that the deceleration under Trump is part of a longer-term US slowing.

This decelerating trend also demonstrates that 2.9% growth achieved by Trump in 2018, while slow by historical standards, was above current US annual average growth – with business cycle consequences analysed below.

Why is US slowdown occurring?

Given this long-term US economic slowdown, to understand US economic perspectives it is evidently crucial to analyse why this is occurring.

  • One explanation ascribes deceleration merely to specific contingent events – trade wars, European economic slowdown etc. If that is correct action by the US authorities, such as Federal Reserve interest rate cuts, may prevent any slowing and create strong US medium/long term growth.
  • The second explanation is that US economic slowing is due to deeper structural features. Indeed, that the US economy in 2018 grew faster than its medium/long term economic potential, and therefore the business cycle upturn in 2018 would be likely to be followed by a business cycle downturn. In that case, measures such as Federal Reserve interest rate cuts might sustain or increase US share prices, but they would be unlikely to halt downward pressures on US economic growth during 2019-2020.

To determine which perspective is correct, it is necessary to analyse the fundamental forces determining US economic dynamics.

Can Trump accelerate the US economy?

To ascertain the reasons for the US economic slowing Table 2 shows all major components of US GDP which are positively correlated with US economic growth during the last fifty years – i.e. factors which, if their structural weight in the US increased, would be expected to be accompanied by higher growth. This shows:

  • US government consumption has a positive but negligible correlation with US GDP growth – the highest correlation is 0.09.
  • US private inventory accumulation is strongly correlated with economic growth, but this merely reflects their strong correlation with the US business cycle. Private inventories are too small a percentage of US GDP to play a key role in US growth in anything other than the short term – in the 50 years 1968-2018 private inventory accumulation averaged only 0.4% of US GDP.

Leaving aside inventories, in the short term no component of US GDP has a strong correlation with US growth – i.e. in the short-term numerous factors affect US GDP growth with no single one playing a decisive role. Over a one to two-year period the highest correlation is only 0.26.

In the medium and long term, however, a very different picture emerges. There is a very high correlation between both US the percentage of net fixed investment (gross fixed investment minus depreciations) in GDP and net saving with GDP growth. Taking a 10-year period the correlation of the percentage of net fixed investment in US GDP with GDP growth is 0.69 – a very high correlation. Even taking a six-year period the correlation between net fixed investment and US GDP growth is 0.54.

Has Trump provided the basis for a serious US economic acceleration?

Data on the determinants of US growth, therefore, gives a clear picture:

  • Medium/long term US growth is primarily determined by net fixed investment. As Qing Yuan’s article in Quishi, ‘Several Issues That Need to be Further Clarified About Sino-US trade Frictions,’ noted regarding the US economy: ‘whether it will continue to prosper depends on the state of capital accumulation,’
  • In the short term no single factor is decisive in growth.

The standard caveat that correlation is not the same as causation is irrelevant in the present case – as the high correlation between US economic growth and net fixed investment means that it is impossible to substantially increase US economic growth over the medium/long term without increasing the rate of net fixed investment.

Therefore, data shows that only if President Trump could achieve a structural shift in the US economy to increase its level of net fixed investment could a substantial medium/long term US economic acceleration be achieved. But Figure 2 shows this has not occurred – US net fixed investment has fallen from 11.3% of GDP in 1966 to only 4.8% in 2019. This fall provides no basis for a medium/long term acceleration of the US economy – and this decline in net fixed investment explains the long-term deceleration of the US economy.

The state of the US business cycle

Turning from medium/long term developments to shorter-term perspectives for 2019-2020 the pattern of the US business cycle flowing from these fundamental trends is clear. Medium/long term growth, slightly over 2%, is determined by the US economy’s net fixed investment, with short-term business cycle fluctuations taking place above and below this long-term growth rate due to numerous factors. Figure 3 illustrates this short-term pattern of fluctuations. As shorter term fluctuations are simply oscillations around an average, when US growth is substantially above the average for any significant period it falls back towards the average, and when growth is substantially below the average for any significant period it then rises above the average – this process producing ‘reversion to the mean’.

Trump is experiencing a normal business cycle

These processes determine the short-term shifts in the US economy under Trump. To illustrate this Figure 4 shows year on year changes in US GDP under 21st century US presidents. This shows both the slower underlying growth of the US economy under Trump which was already analysed and fluctuations in the current business cycle. In the 2ndquarter of 2016, the US presidential election year, US growth fell to 1.3% – this extremely slow growth significantly contributing to Trump’s election victory. Such growth was far below the long-term US average – the 20-year moving average of annual average US GDP growth in 2016 was 2.4%. As 2016 was an extreme downturn of the US business cycle this was duly followed by a cyclical upturn in 2018. The increase in US growth in 2018 was not a fundamental growth acceleration but a normal cyclical upturn. It may indeed easily be verified that this upturn of the US business cycle under Trump was merely a normal business cycle one. US growth in the 2nd quarter of 2016 was 1.1% below its long-term average at that time. By the latest available data, for 1st quarter 2019, US long term growth had fallen to 2.1%. Merely to maintain a constant long-term average, therefore, a fluctuation upward of 1.1% would be expected. The 3.2% US growth in the first quarter of 2019, 1.1% above the US long term growth rate, is therefore exactly what would be expected for the peak of a normal business circle upturn – and did not represent an acceleration of medium/long term growth.

Trump’s response to economic downturn

That 3.2% year on year growth in the 1st quarter of 2019 indicates the normal expected peak growth in a US business cycle, however, has the conclusion that the beginning of a normal business cycle downturn would be expected – an undesirable development for president Trump given a presidential election in 16 months. The Trump administration will therefore do everything possible to attempt to delay this slowdown. Given that it rejects state intervention in the economy, and is already running a very large budget deficit, the only weapon available to attempt to limit an economic slowdown in the run up to the presidential election is interest rate reductions – hence President Trump’s public demand the Federal Reserve cut interest rates.

The IMF’s projections

It was shown it is unlikely there will be a US recession in 2019 but that, for business cycle reasons, the US economy will slow in 2019. Therefore, by how much will the US economy slow in 2019-2020?

A starting point may be taken as the IMF’s projections in Figure 5, which predict a fall in US growth from 2.9% in 2018 to 2.3% in 2019 and only 1.9% in 2020. This last figure is a whole percentage point below US growth in 2018 and would represent a major economic slowdown. However, this IMF projection looks slightly pessimistic for two reasons. First, it implies that US long term growth slows to only 2.0% by 2020 – there is no indication why this should occur given that US net fixed investment is low but not falling. Second it may be assumed that President Trump will do everything possible to prevent such a sharp slowdown in an election year. For these reasons it would appear reasonable to assume a slightly higher growth figure in 2019, say 2.5% – although the IMF figure is not unreasonable. Either trend, however, indicates that the Trump administration’s claims that US growth will accelerate are false. In summary, the Trump administration will be under downward economic pressure in the period leading to the Presidential election.

Conclusion

The conclusions are therefore clear.

  • The US economic upturn in 2018 was merely a normal business cycle and not any fundamental acceleration of the US economy. The long-term growth of the US economy continues to fall gradually.
  • As 2018 was merely a normal business cycle upturn it will be followed by a normal business cycle downturn – that is, while not facing a recession in 2019, the Trump administration will be under pressure of a slowing economy in 2019-2020.

The abrupt change in policy by the Federal Reserve in summer 2019 was, therefore, not a response to purely peripheral or short-term factors but was a response to deep seated processes slowing the US economy.

This article was previously published on Learning from China.

Gloomy outlook for the British economy – only Labour is willing to rescue it

By Tom O’Leary

The latest surveys from the Purchasing Mangers’ Institute (PMI) show the British economy slowing sharply.

The manufacturing PMI in June fell to 48.0 (from 49.4), the lowest level since February 2013, shown in Chart 1 below.  According to the survey providers IHS Markit, this survey reading is consistent with a contraction in output of 4% from a year ago.

Chart 1. UK Manufacturing PMI Survey, April 2019

This latest downturn in output represents an acceleration of the long-term decline of both manufacturing and industrial production (which includes energy and water supplies). The current reading for the index level of industrial production was 101.4. This is less than 1% higher than when the Tory/LibDem coalition took office in May 2010 and is now 9% lower than the pre-recession peak in May 2007. At the same time, the manufacturing index is now 102 and has recovered by 5.9% since May 2010, but is still 3.6% below its pre-recession peak while the survey evidence from the PMI shows it is heading lower. These medium-term trends are shown in Chart 2 below.

Chart 2. UK Industrial production and Manufacturing Indices, January 2008 to April 2018.

The global context is a negative one. The global manufacturing PMI dived in June to 49.4, the lowest level for 6 years (Chart 3).  Key regional hubs for international production and trade such as South Korea have been badly hit, and the worst-affected country in the June survey was Germany, one of the largest economies most connected to global production chains. Slowing world trade and trade tariffs imposed the US are clearly having a widespread negative impact, with export orders the weakest component of all in the survey.

Chart 3. Global manufacturing PMI June 2019

But the entire British economy is struggling, not just manufacturing.  The June construction PMI plummeted to 43.1 (from 48.6 in May) and the services sector PMI and the services sector PMI slid to 50.2 (from 51), close to stagnation.  All three PMI indices are shown in Chart 4 below.

Chart 4. PMIs for manufacturing, services and construction, June

Construction is the least internationalised of the three sectors, and the least susceptible to changes in international conditions as a result. It is clearly leading the way in the downturn in the British economy. This is a domestic crisis, within a global slowdown.

Clearly, the domestic aspect is Brexit-related.  All three sectors within construction fell, house-building, commercial construction (shops, factories and so on) and civil engineering (public and private infrastructure construction), suggesting the unwillingness to invest is broad-based.

The rising risk of a No Deal outcome will only put further downward pressure on the economy.  Expectations of the next move in official interest rates have done a U-turn as a result, with markets now priced in line with future rate cuts. The National Institute assumes that GDP will have grown by just 0.2% in the 3 months to June.

Perhaps the most startling financial market indicator of the crisis is the fact that the UK government bonds linked to inflation (‘index-linked gilts’) are all offering interest rates lower than minus 2%. This means that the UK government can borrow at negative real interest rates, once CPI inflation is taken into account, for anything between 3 years and 18 years.

But with the two Tory rivals speaking only about tax cuts for businesses and the rich, only a Labour government would be willing to take advantage of this opportunity to increase borrowing for investment.

Trade war – bad polls & bad economic numbers pressure Trump

By John Ross

US share markets rose sharply on news of the announcement that Presidents Xi and Trump would meet at the G20 summit – as the Financial Times simply summarised it ‘Trump plan to meet Xi on trade sends US equities sharply higher’. This was a welcome piece of goods news for President Trump after a period during which he had been receiving bad news both on the opinion polls for his re-election and for the US economy. Naturally there are many aspects of the planned meeting that only those involved in the negotiations will know, but it is worth noting the objective pressures which are now bearing down on Trump.

Negative polls for Trump at the beginning of the Presidential election campaign

The first, and probably most important pressure on President Trump, was that opinion polls leading to the official launch of his re-election campaign on 18 June had been unfavourable for several months. Days before his official relaunch event his campaign dismissed three of his five polling advisers after leaks of internal polling showed the president had been trailing former Democrat Vice President Joe Biden in key states which would decide the outcome of the 2020 election – for example in Minnesota Trump trailed Biden 40% to 54% and in Michigan by 40% to 53%. Analysing 17 states, polling taken in March showed Trump trailing Biden by double digits in key swing states such as Wisconsin, Pennsylvania, Florida and Michigan. More recent polls on 9-12 June, released by Fox News, a strongly pro-Trump TV channel, showed Trump nationally trailing nine percent behind Democrat Bernie Sanders (40% to 49%) and ten percent behind Biden (39% to 49%).

In summary as the Presidential election campaign was launched Trump was trailing badly behind Democratic rivals. In that political situation, evidently, the prospects for the US economy in 2019-2020 were crucial for Trump.

Prospects for the US economy in 2019-2020

Regarding these economic prospects for the US in 2019-2020 two substantially different perspectives for the US economy in 2019-20 had been put forward. The first, that of the Trump administration itself, echoed by some media in China, argued that due to the US tax cuts, or other reasons, the US economy would speed up in 2019 – which would evidently be good political news for Trump. In March 2019, in its official budget forecasts, the Trump administration projected 3.2% GDP growth in 2019 and 3.1% in 2020 – both faster than the 2.9% in 2018 and in line with President Trump’s claim that the US economy would grow at least 3% a year during his presidency.

The second perspective, held by the IMF, the present author, and others, was that the US economy would experience downward pressure in 2019 – not that there would be a recession but that the US economy would slow. The most recent US economic data has clearly confirmed this latter perspective.

US total industrial production, including the oil and gas sector, had stalled since the end of 2018 – by May US total industrial production was 0.9% lower than in December 2018. The decline in US manufacturing production, 1.5% in the same period, was sharper. In May 2019 US manufacturing production was still 4.8% lower than its level more than 11 years previously in December 2007 – the Trump policy to attempt to strongly revive US manufacturing production had been a failure.

In terms of Purchasing Managers Indexes (PMI), the US Composite PMI stood at 50.9 in May 2019 sharply down from 53.0 in April and the weakest expansion in the private sector since May 2016. The US manufacturing PMI in the same month fell to its lowest level since 2009 – a manufacturing PMI of 50.5 vs 52.6 in April, while the services PMI slowed to a 39-month low – at 50.9 at vs 53 in April.

US jobs data showed the same slowing trend. In May the US added only 75,000 non-farm payroll jobs compared to 224,000 in April and an average 144,000 in the three previous months.

Analysts who believe there will be a recession

Some important Western and US analysts believed that this slowing was so severe it indicated the US would enter a recession – that is at least two quarters of negative growth. For example, John Authers, Senior Bloomberg Editor for Markets and former Chief Markets Commentator for the Financial Times, made the following analysis on 18 June under the self-explanatory headline ‘Markets Are Acting Like a Recession Is Unavoidable’ with the subheading ‘It’s not just the bond market that’s signalling a severe economic slowdown.’

‘Would it be possible to explain what is going on in markets without making reference to the deteriorating U.S.-China trade relations? I am beginning to suspect that it would. Bond markets may be behaving as though they are bracing for something terrible to happen because traders are, indeed, scared that something terrible is going to happen.

‘Exhibit A is the Federal Reserve Bank of New York’s Empire State Manufacturing Index that was released Monday. It was terrible, showing the biggest monthly decline since the last recession…  it doesn’t drop this low for long without presaging a true recession to come.

‘Conditions for the U.S. trucking industry, often regarded as a leading indicator for manufacturing, look no better…. the FTR Trucking Conditions Index… combines several different factors about demand for trucking. Figures below zero show a risk of contraction.

‘Industrial metals provide another strong market-based recession indicator. The Bloomberg Industrial Metals Subindex suggests that the optimism on growth that accompanied the first year of the Trump administration has dissipated.

‘Looking at the U.S. stock market, we see the type of relative performance that would be expected in the run-up to a recession, even if the overall market continues to show robust performance…  Investors tend not to buy utilities on the scale that we have seen lately unless they are pessimistic. There are technical factors in the bond market that have driven the current deflation scare, but there do appear to be a number of factors pointing toward an economic slowdown.’

A slowdown not a recession

The analysis of the present author is that the view that the US economy will move into recession this year are exaggerated, for reasons which are analysed at length in my book ‘Don’t Misunderstand China’s Economy’.

US growth in 2018 was 2.9% – at the peak of the upswing of a business cycle. It would be an extraordinarily sharp decline, approaching the scale of the international financial crisis of 2008, for the US to fall from the peak of a business cycle to a recession in a single year. Conditions for such a repeat of the greatest financial crisis for 80 years, since the Great Depression, are not indicated at present. Instead a slowdown of the US economy, not an actual recession, will occur in 2019. The IMF itself projects a fall in US growth from 2.9% in 2018 to 2.3% in 2019 – I would estimate that growth could be slightly higher, but the IMF figure is not unreasonable. But what such a trend indicates is that the Trump administration’s claims that US growth would accelerate are false. Instead growth in 2019 would fall. And growth in 2020 would be lower than in 2019 – a serious issue for Trump as 2020 is an election year.

Certainly, information which leaked on the same day that the Xi Jinping – Trump summit was announced indicated clearly the Trump administration felt seriously concerned about the state of the US economy. It was leaked to Bloomberg that, in an unprecedented move, the Trump administration had explored if it was possible legally to dismiss their own appointed Chair of the US Federal Reserve Jerome Powell – who had only take up office in February 2018.  This was immediately understood to indicate that the Trump administration feared the downward pressure on the US economy.

It is important not to exaggerate. It is still 17 months to the US presidential election. This means the bad polling numbers for Trump can still be overcome – but they are clearly a negative for him. While some US analysts project a recession in 2019, for the reasons given here it is much more likely that the US economy will slow in 2019 rather than a recession occur – although if the economy slows significantly in 2019 a recession in 2020 is entirely not impossible, which would clearly be ultra-negative for Trump. But even without an actual recession what this combination of bad polling numbers and economic deceleration does produce is clearly pressure on the Trump administration.

This is not the only factor in the situation, but it is clearly part of the background to the Xi-Trump summit at the G20.

Author’s Note: This article was finished before it was made public that the US side requested the phone call with China which led to agreement on the Xi Jinping-Trump summit. This information is in line with the analysis in the article.

*   *   *

This article was previously published at Learning From China, and originally appeared in Chinese at Guancha.cn.

Public sector finances – new developments highlight why the Corbyn-McDonnell are right on fiscal policy

By Tom O’Leary

The changes to public finances following 9 years of austerity are very significant, and deserve greater attention as they were the purported reason for the attack on the living standards of workers and the poor. The changes also highlight both the superiority of Corbyn’s fiscal policy and the scope to immediately begin its implementation. The beginning of the end of austerity ‘only’ requires the election of a Corbyn-led Labour government.

The cloak of austerity

The hue and cry over the state of public finances at the outset of the economic crisis in 2008 was always a cloak for a transfer of incomes from workers and the poor to big business and the rich. The real content of austerity was an offensive to boost profits at the expense of both wages and the necessary funding for public services.

Like monetarism and ‘shadowing the DeutscheMark’ before it, austerity was a government-led project on behalf of the entire ruling class that was meant to restore profitability by increasing the rate of exploitation.  The rate of exploitation is here meant in the Marxist sense, the ratio between the proportion of total output that are retained by labour and proportion claimed by capital. In mainstream economics this is referred to as ‘share of national income’, but total incomes are equal to total production in aggregate.

As in the previous cases noted above, a spurious reason (inflation, currency stability, public finances) was offered to mask the real content of the project. In all cases, the social surplus generated through taxation was redistributed in favour of business through lower corporate taxes and away from public services and the funding of social security. There was a public sector pay freeze and an outright cut in welfare entitlements.  

The project has only had limited success. Fig.1 below shows the rate of return on capital employed by UK companies, a key component of profitability. This was initially boosted after austerity policies were imposed. But those policies were eased a little in the run-up to the 2015 general election to help engineer a Tory victory, and the boost to profits has dissipated ever since, even as austerity policies continued. The clear implication is that austerity policies will be extended unless and until there is a full-scale recovery in profitability, and that they are now highly unpopular.

Chart 1. Rates of Return on Capital Employed by UK Companies

Public finances now

Yet there has been a significant change in public finances since austerity was first imposed in June 2010 in the Tory/LibDem Coalition emergency budget. As the latest Financial Year (FY) has recently ended, it is possible to make very direct comparisons. The key aspects of this significant change include:

  • Public sector net borrowing (excluding the bank bailout) in FY2018/19 has fallen to £23.5 billion, compared to £136.5 billion in FY2010/11
  • This is a fall in public borrowing from 8.4% of GDP to 1.1% of GDP over that period
  • Within that total borrowing, the public sector current budget balance  (excluding the bank bailout) has switched from a deficit of £90.7bn to a surplus of more than £19 billion in the latest Financial Year
  • Crucially public sector net investment is virtually unchanged in nominal terms, at £45.7 billion in FY 2010/11 to £43.3 billion in FY 2018/19. But this represents a significant fall in net public sector investment from 2.8% of GDP to 2.0% of GDP.

Naturally, Tory ministers and their supporters in the media would suggest that this demonstrates the ‘success’ of austerity and continue to claim it was unavoidable. This nonsense is not widely aired currently, because of the deep unpopularity of austerity.

The project has been an attempt to resolve the capitalist crisis by shifting the burden of it onto the workers and poor.  But, while they have suffered badly and living standards have fallen outright, a resolution of the crisis still seems a distant prospect.

This attack on workers and the poor is shown in the public finances themselves.  Fig.2 below reproduces the chart from the Office for Budget Responsibility (OBR) showing total government receipts and spending as a proportion of GDP.  In 2010, public sector current receipts have risen from 35% of GDP to 36.9% of GDP while total managed expenditure has fallen from 44.9% to 38% of GDP.

Chart 2. Total government receipts and spending

From 2010 public sector receipts have seen their slowest rise in the entire period since World War II. This reflects repeated tax cuts for business and the highest earners, as well as the general stagnation of the economy. At the same time total managed expenditure has seen fallen sharply, only less sharp than the introduction of ‘monetarism’ first by Denis Healey and then taken up with a vengeance by Margaret Thatcher.

Also from 2010, public sector investment has been cut even more severely, falling outright in real terms from £60 billion in Financial Year 2009/10 to £42.5 billion in FY2018/19. This is shown in Fig.3 below.

Chart 3. Real Public sector finances, receipts, expenditure and net investment, £ billion

It is important to note that the rate of inflation has been very high over the period, as repeated falls in the value of the pound have pushed import prices higher. The total rise in prices over the period from when austerity was first implemented (June 2010) has been just under 20% (using the CPI measure). 

This has produced an improvement in government finances in two ways. First, VAT receipts, which account for one-fifth of all government tax revenues have risen as a result of these price increases.  Secondly, the government freeze on public sector pay has produced an extraordinary ‘windfall’, by cutting public sector workers’ pay very sharply in real terms. Of course, in the opposite direction government procurement costs will also have been increased by the surges in inflation over the period.

Corbyn/McDonnell fiscal framework

The British economy clearly remains in a crisis, and is stagnating. A radical change in policy is therefore imperative.

John McDonnell has set out an entirely new fiscal framework for Labour, which is far superior to Labour’s post-World War II policy of ‘keynesian’ demand management.  That policy collapsed with the end of the long post-war boom in the 1970s. Subsequent attempts to recreate it by low interest rates and high government borrowing for Consumption from the turn of this century laid the basis for the banking crash and recession in 2007/08.

Instead, Labour’s fiscal credibility rule (pdf) aims to balance spending and receipts on the current budget, and borrow only for Investment. As Investment is the most important factor in generating economic expansion, this is a decisive shift. It allows Labour to borrow in the most effective way to raise living standards sustainably over the long-term. Enduring rises in prosperity, which are or should be the ultimate aim of all progressive or socialist economic policy are not sustainable unless preceded by an increase in the productive capacity of the economy through Investment.

This important change in Labour’s policy was initially attacked by those wedded to the old, failed ‘keynesian’ framework on the ridiculous grounds that Corbyn and McDonnell were intending to implement austerity.  In fact, Labour’s 2017 election manifesto was accompanied by a separate document itemising a costed commitment (pdf) to increase spending by £48.6 billion. This represents a 5.8% increase over current total government current spending, or approximately 5.3% over projected total current spending by the time of a 2022 general election. The commitments are funded through taxes on big business, tax evaders and the very highest earners. This is not austerity, but the beginning of reversing it.

Crucially, the fiscal framework allows for an increase in borrowing for Investment.  Investment increases the productive capacity of the economy and is defined (in government terms) as providing a financial return on government outlays.  In Labour’s plans, the average annual outlay for this increased Investment is £25 billion per annum, which is equivalent to approximately 1.2% of GDP.  This is in addition to the level of Investment inherited from the Tory government.  As noted above, the average private return on capital is currently approximately 12.5%. There is no reason why public sector returns on capital Investment should not be as least as great.

To be clear, this is not the introduction of socialism, or anything resembling it. But is a series of significant reforms which are feasible and will improve the lives of millions of workers. It runs counter to the entire project of the British ruling class, and so will face extremely determined and powerful opposition.

The new situation

But there are two important developments which have changed backgrounds for the application of this correct fiscal approach.

The first is the state of public finances themselves. As noted above, the balance on current spending has swung into a surplus. Secondly, at the same time, the economic outlook is increasingly gloomy.

This is not simply a short-term or Brexit-related development, although it is clear that firms have been stockpiling produce and cutting Investment over the course of several months.  Instead, it is the slowdown in the world economy, the deceleration in business investment throughout the advanced industrialised economies and the fact that the British economy will suffer prolonged damage from Brexit which together offer a very negative outlook.

Fig.4 below reproduces a chart from the Office for National Statistics (ONS) showing the level of real business investment since the recession began. Business investment has contracted throughout the whole of 2018 and seems set to deteriorate sharply, based on survey evidence. In total, business investment is less than 6% higher than prior to its recession high-point in the 2nd quarter of 2008. On current trends there is a risk that the modest rise in business investment since the recession will dissipate altogether.

This combination of factors provides both a threat as well as an opportunity. Clearly, if profits have not recovered, austerity will be resumed.  But the state of public sector finances means that there is also increased scope for an incoming Labour government to tackle the crisis. The surplus on the current budget for the FY just ended was over £19 billion. The OBR (which admittedly has a poor forecasting record) assumes the surplus on this measure will widen to £77 billion in FY2021/22, the last possible year for a general election.

Certainly, some of this surplus could be used to supplement the £48.6 billion in taxation revenues that Labour intends to spend to reverse austerity.  But not all of it should be.  Because Investment creates new means of production, the higher the sustainable level of funds allocated to Investment, the greater the growth in the means of production and in living standards that will follow.

Of course, no-one in the Labour leadership or elsewhere can know precisely how the economy will fare over the next period, nor how the new Tory leader may change either government current spending or government net Investment before then.  So, any commitments must take account of that uncertainty. But the existence of the surplus on the current budget means that increased commitments are possible without increased borrowing, while still meeting the fiscal rule.

Given its decisive role in creating new productive capacity of the economy, optimising the level of Investment should be the first priority. Taking the lower sum of approximately £20 billion in surplus of the current budget balance, this should be reallocated between current and Investment outlays for an incoming Labour government. In the current framework, the approximate ratio between increased current spending (£49 billion) and increased Investment (£25 billion annually) is 2:1. Using this as ceiling, a rule could be introduced that the ratio of additional spending between the current budget and Investment goes no higher than this.  So, of the latest current budget surplus of over £19 billion, a minimum of £6.5 billion (one-third of the total) should be allocated to additional Investment.

At the same time, the Tory government continues to cut net public Investment.  This is part of the austerity offensive, which includes removing the state from any part of the economy that could be conducted by the private sector, even at much greater cost.  On Labour’s current plans, the additional £25 billion in net investment is in addition to the current government’s £43 billion Investment for a total of £68 billion. This is currently equivalent to approximately 3.4% of GDP. This is the same as at the outset of and in response to the financial crisis in 2007 and 2008.

As the Tories may well cut net public Investment even further, as a safeguard Labour could also commit that its total commitment will not fall below 3.4% of GDP.

In summary, austerity will continue while the recovery in profits remains elusive. What is required is a government with entirely different priorities, ending austerity and raising living standards by a combination of increased taxation and borrowing for Investment. That means a Corbyn-led government. 

The current state of public finances also means that Labour’s plans can be applied in new circumstances, as the current budget is now in surplus. Without any additional increase in public borrowing, the current budget surplus can be used both to take further steps in reversing austerity and in raising the level of Investment. 

Bolsonaro’s radical neo-liberal offensive in Brazil

By Fiona Edwards

Jair Bolsonaro’s administration has wasted little time in advancing its project of systematically destroying the role of the state in Brazil’s economy. Bolsonaro’s radical neo-liberal offensive simultaneously encompasses drastic attacks on the economic and social rights of Brazil’s working class in addition to threatening the long term economic and social development of the country. Bolsonaro is effectively auctioning off Brazil’s future for the benefit of US capital and its allies.

The neo-liberal offensive is taking place on several fronts and includes a drastic attack on pensions, a huge programme of privatisation and the undermining of the technological development of Brazil’s economy.

Bolsonaro’s administration has embraced the era of ‘permanent austerity’ which was institutionalised by his predecessor Michael Temer who presided over Brazil from 2016-2018 following a coup that removed Workers Party (PT) President Dilma Rousseff.

Temer introduced a new ‘expenditure ceiling’ in December 2016 through a Constitutional Amendment which mandates a zero real growth rule for federal primary expenditures for the next 20 years. Temer’s harsh austerity programme made him extremely unpopular – his approval rating by the end of his Presidency was just 4% – and has left Brazil’s economy essentially stagnant, with growth of only 1% in 2017 and 1.1% in 2018 according to the World Bank.

Bolsonaro is attempting to deepen, accelerate and intensify the austerity offensive in Brazil. The project has been very bluntly described by Bolsonaro’s Minister of the Economy, Paulo Guedes, who said that he intends to “sell everything.”

Guedes has assembled a team which includes fellow University of Chicago trained economists and that is determined to systematically dismantle the state’s role in Brazil’s economy with a massive programme of privatisation and an almighty assault on the living standards of the overwhelming majority of the population.

A defining feature of Bolsonaro’s neo-liberal offensive includes the selling off of strategically important assets and industries that are crucial to Brazil’s future development to US corporations, in violation of Brazil’s national interests.

From the point of view of developing Brazil’s economy and raising the living standards of the population, Bolsonaro’s neo-liberal offensive is the exact opposite of what is required.

Bolsonaro’s drastic attack on pensions

The centrepiece of Bolsonaro’s neo-liberal offensive is a dramatic, vicious and politically unpopular attack on pensions.

Under Bolsonaro’s plan, which is currently under discussion in Brazil’s Congress, workers would lose $261 billion over the next 10 year as a result of their pension benefits being slashed and a drastic increase in the age of retirement. Under the current system men and women can claim pension benefits after 30-to-35 years of contributions respectively, which allows many to retire in their mid-50s. The proposal Bolsonaro has put to Congress would increase the minimum retirement age for both public and private sector workers to 65 for men and 62 for women.

Bolsonaro needs to persuade 308 out of 513 members of Brazil’s politically splintered lower house of Congress to vote for his Pensions Bill in order to get it passed. The unpopularity of the attack – a recent opinion poll from DataFolha showed that 51% of Brazilians are against the pensions ‘reform’ – and the resolute opposition from Brazil’s Workers Party (PT), other left wing political parties and the trade unions makes it difficult for Bolsonaro to win the necessary support in Congress to pass his proposals.

On Monday 15 April 2019, the Workers Party (PT) led the opposition political parties in the lower House in winning a majority to delay the pensions ‘reform’. Bolsonaro needs an additional 140 votes to push through his attack on pensions which would require him to build a coalition with the Brazilian Social Democracy Party and the Democratic Movement Party.

A recent article in the New York Times assesses the outlook of the Pensions Bill passing as “growing dimmer” and reports that “hearings on pension changes have devolved into shouting matches, frustrating proponents inside and outside the government, and leading even former allies to speak of Mr. Bolsonaro with open contempt.”

Bolsonaro’s team are proposing to launch a massive attack on healthcare and education should the attack on pensions fail to attract the support necessary to pass through Congress. The “Plan B” proposes to remove the constitutional guarantees which are currently in place for the funding for health and education and has been put forward alongside the Pensions Bill so that it can be used as a bargaining chip.

Radical privatisation agenda

Whilst Bolsonaro’s administration has disappointed US capital with its failure to launch a quick, successful, striking attack on pensions, it has succeeded in advancing an aggressive privatisation agenda.

In January, Bolsonaro’s Minister of Infrastructure Tarcisio Gomes de Freitas declared that the new government intended to privatise or liquidate about 100 state-owned companies during 2019, including the privatisation of key infrastructure such as railroads, ports and airports. The head of Brazil’s new Privatisation Secretariat, Salim Mattar, announced that Bolsonaro’s administration planned to raise $20 billion from the sale of state shares in public companies in 2019 alone.

Paulo Guedes reported on the progress of the Brazilian government’s privatisation programme at a recent conference in New York, stating that privatisation proceeds so far this year had reached £12 billion and expressed confidence that the goal of raising $20 billion from the sale of public assets this year will be exceeded by 40%. He also stated that the government intends to accelerate the pace of privatisation over Bolsonaro’s four year term.

In March 12 regional airports were sold off and now the Brazilian government are preparing to sell off a further 22 other airports later this year.

Crucially, Bolsonaro’s team plans to diminish Brazil’s biggest state company, the oil giant Petrobras. Salim Mattar, the leader of Brazil’s Privatisation Secretariat, announced that the Brazilian government wanted Petrobras to sell most of its 36 subsidiaries within four years in addition to privatising the Brazil state-owned power company Electrobras.

Guedes has appointed a fellow University of Chicago alumni, economist Roberto Castello Branco who is a fierce critic of state intervention in the economy and a consistent advocate of the complete privatisation of state-owned companies, to run Petrobras.

From the moment he was appointed Branco has made it clear he intends to push forward a “divestment plan” which will entail the sale of mature oil fields in addition to opening the refining sector, which Petrobras currently has a monopoly over, to the benefit of multinational corporations. Branco considers it “inconceivable” that one state-owned company has 98% of the country’s refining capacity and declared that monopolies are “absurd.” Jose Maria Rangel of the Single Federation of Petroleum Workers (FUP) has criticised Branco’s plans, stating “Petrobras is going to move to sell its refineries and fields, moving forward to reduce our company to serve international capital.”

In April 2019 the Brazilian government announced that Petrobras intends to start selling 50% of its refining capacity in June 2019, which is equivalent to 1.1 million barrels of oil per day. Such a move would severely diminish Petrobras.

The Bolsonaro administration is also undermining Brazil’s state banks in order to diminish the role of state investment in the economy. The main target is Brazil’s National Bank for Economic and Social Development (BNDES), the largest development lender in the Americas which under the Workers Party financed projects in many Latin American and African countries. Bolsonaro opposes BNDES’ practice of lending money at low interest rates to build “national champion” companies which was done under the left wing Workers Party governments from 2003 to 2016. BNDES is currently in the process of reducing its stake in the state-controlled oil company Petrobras.

Undermining the technological advancement of Brazil’s economy

Another feature of Bolsonaro’s neo-liberal agenda is to undermine Brazilian science and national technological development.

A crucial decision was made by the Brazilian government in February 2019 to approve the sale of the majority of Embraer’s commercial division to the US corporation Boeing. Embraer is a huge Brazilian aerospace company which is the third largest producer of civil aircraft after Boeing and Airbus. 80% of Embraer’s profitable commercial division is being sold-off to Boeing.

This decision means that Brazil is losing its only large, high-tech, profitable company, which will have a negative impact on the development of new strategic projects.

Manuela D’Avila, the left’s Vice President Candidate in the Brazilian elections of 2018, and member of the Communist Party of Brazil has outlined the significance of the sale of Embraer in undermining Brazil’s development:

“When Embraer was founded during the end of the 1960s, it overcame the disbelief that Brazil could make planes that could fly the entire world. This is now a reality. Today, Embraer is a private, open capital company that is strategic to Brazil in terms of innovation, economics and national defense.

“Due to the strategic nature of Embraer, the Brazilian government – which is a shareholder in the company – has a special type of stock, called a golden share, which gives it veto power and the final word over negotiations that are considered strategic, so that it can avoid allowing international transactions like this to damage our national interests.

“It is an initiative of national betrayal. The main impact of the possible sale of Embraer, is loss of intelligence and restrictions on the nation’s technological development.

“However, the debate over Embraer is opportune because it reminds us of what we want to be as a nation. Do we want to be a nation that produces knowledge and products of aggregated value or one that merely exports commodities?”

In addition to selling off the majority of Brazil’s most successful high-tech company, Bolsonaro’s government has also announced that it has frozen 42% of the budget for the country’s Science and Communications Ministry. This freeze will further undermine Brazil’s scientific and technological development. The Brazilian Science Academy and five other scientific societies have condemned the decision stating, “it will take many decades to rebuild the country’s science and innovation capacity” unless this decision is reversed.

Bolsonaro’s rising unpopularity

Bolsonaro already has the worst approval rating of any elected President by this point in their first term since democracy was restored in the 1980s. 30% of the population regard Bolsonaro as “bad or awful”, 33% have a neutral view and 32% believe he is “great or good.” On the day of his inauguration on 1 January Bolsonaro’s approval rating was 49%. However, there remains some illusions in optimism for Bolsonaro’s Presidency – with 59% believing that his government will be “great or good.”

New economic data shows that unemployment is rising in Bolsonaro’s Brazil – it increased from 11.6% in November 2018 to 12.4% in February 2019. Meanwhile the Central Bank has released data indicating that GDP fell by 0.73% in February of this year, compared to the previous month.

The clear priority of the Bolsonaro administration is to pursue an aggressive neo-liberal agenda to maximise profits for US capital and its allies in Brazil whatever the costs to Brazil’s overall development or the living standards of the population. Such an agenda, which is against the interests of the overwhelming majority of the Brazilian population, is unlikely to improve Bolsonaro’s approval ratings as it involves such a tremendous attack on Brazil’s population.

The exact opposite approach to Bolsonaro’s neo-liberal offensive is required to develop Brazil’s economy, improve living standards and advance social progress for the majority of Brazilians. Increasing state investment to build “national champion” companies, using state banks as a channel to promote public investment and building rather than selling off high technology companies is a path to Brazilian development and independence. Bolsonaro’s approach is a path to dependency and subordination to the US.

This article was originally published here on Eyes on Latin America

Why China maintained its strong economic growth

Why China maintained its strong economic growth

By John Ross

Introduction

China’s GDP growth in the 1st quarter of 2019 was 6.4% – the same as in the last quarter of 2018. This figure, and other economic data released at the same time, refuted predictions of sharp economic downturn in China made in the Western media.

The Financial Times headline regarding the first quarter’s results was ‘China GDP grows faster than expected in first quarter’ – by which it meant faster than the FT had expected! The Wall Street Journal’s headline similarly was ‘China Growth Beats Expectations… Many economists prepared for a weaker first-quarter performance’ – by which it meant economists the Wall Street Journal had paid attention to had expected a weaker performance.

In reality, however, there was no need to anticipate any unacceptable slowing of China’s economy provided that current trends were correctly understood.

First, appropriate short-term stimulus measures had already been taken and are working their way through the economy.

A significant credit stimulus has been given. Bank lending was 1.7 trillion yuan ($254 billion) in March compared to 0.9 trillion ($135 billion) in February. Total social financing increased by 2.9 trillion yuan ($433 billion) in March compared to 0.7 trillion yuan ($105 billion) in February. The effect of this stimulus was shown in the good data for March – with an 8.5% increase in industrial production, the best since 2014, and an 8.7% increase in retail sales. Exports in March rose by 14.2% year on year in dollar terms.

China’s official manufacturing PMI rose from 49.2 in February to 50.5 in March. The Caixin manufacturing PMI, more weighted towards smaller firms, rose from 49.9 in February to 50.8 in March. The official non-manufacturing PMI strengthened its expansion from 54.3 to 54.8.

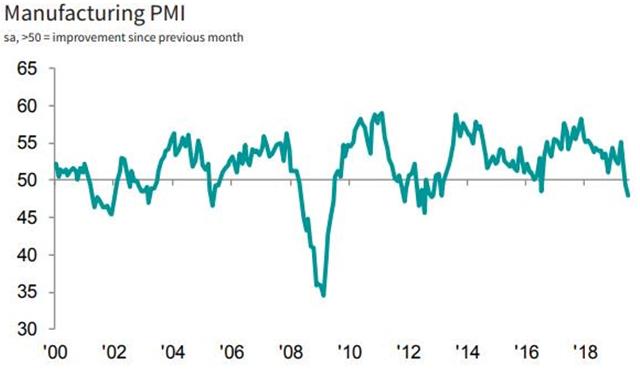
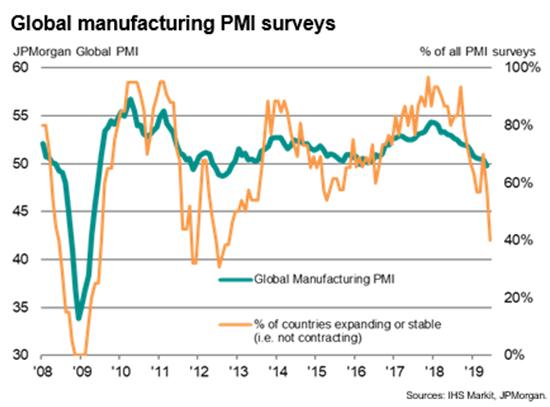
This strengthening data in March is particularly good in light of the international slowdown being predicted by the IMF and other international economic organisations.

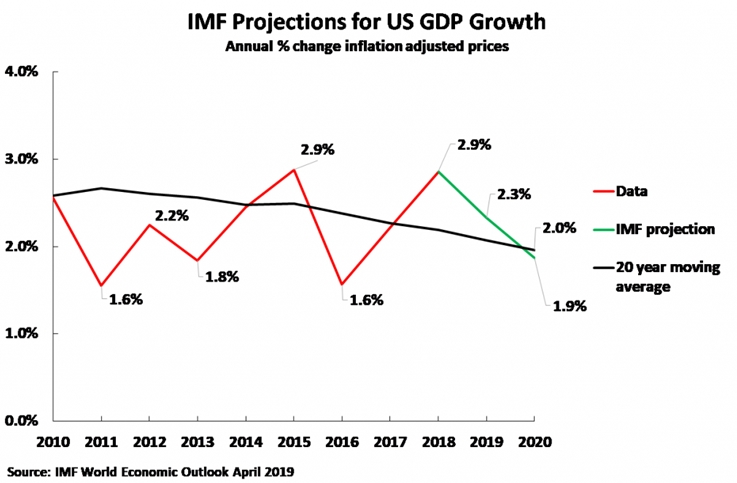
The IMF projects that GDP growth in the advanced economies as a whole will fall from 2.3% in 2018 to 1.8% in 2019. The slowdown in the largest Western economic centres is estimated to be even greater. The IMF projects that EU growth will fall from 2.1% in 2018 to 1.6% in 2019, a decline of 0.5%, and US growth will fall from 2.9% to 2.3% in the same period – a decline of 0.6%. As the growth rate of the Western economies is much slower than China this means that this slowdown in the US and EU is proportionately much greater compared to its starting point than in China.

But in addition to these short-term trends in China’s economy what is even more important for the medium term was the turnaround in fixed investment. The rise in fixed asset investment was 6.3% year on year – up from 6.1% in the previous month and from a low point of 5.3% in August 2018.

The reason this is crucial is set out in the article below. It shows in a detailed way that it is investment, and not any other major factor in the economy, which controls China’s rate of economic growth – as it does in other major economies. In addition to its medium-term effect it was the fall in fixed investment which led to the economic slowdown in the second half of 2018, and the upturn which led to the good results in the first quarter of 2019 and in March in particular. Quantitative analysis of the data therefore confirms that it is fixed investment which is the most powerful factor in China’s medium-term economic development and its short-term macroeconomic regulation.

The article below was written before the publication of the first quarter 2019 economic data in order to analyse current US policy towards China and China’s economic slowdown during 2018. Its conclusion was clear ‘policies which affect capital inputs into China’s economy, that is investment’ have the most powerful effect in ‘lowering, sustaining or raising China’s economic growth rate.’ But the new economic data for the first quarter of 2019 strongly confirms the analysis of the article. The analysis in the article therefore deals with both short term and medium-term trends in China’s economy.

The economic context of current US policy towards China

US trade policy towards China has not only economic but directly geopolitical goals. The latter is to attempt to slow down China’s economic development to the point where this creates problems for the Communist Party of China (CPC). As the Wall Street Journal, put it, openly hoping for this result: ‘China’s economy is slowing, which could dent support for Communist Party leadership.’. This key journal of US hard liners expressed fear that in the China-US trade negotiations there was a danger of: ‘a deal that won’t lead to fundamental changes by China, including reducing the power of its state-owned enterprises.’ This latter goal, however, was a means to another end. As the Wall Street Journal summarised it in another article regarding the aims of US anti-China hardliners, they were: ‘focussed on steps forcing China to give ground on issues it sees as crucial to maintaining the Communist Party’s rule.’

The Washington Post, one of the most influential US political newspapers, put it similarly urging a hard-line: ‘One of the main points of contention in the protracted trade discussion has been the role of China’s state-owned enterprises.’ It noted: ‘Trump is demanding… a sweeping overhaul of China’s economy a key condition for ending the U.S.-China trade war…. Securing… assent to abandon the economic model that lifted China… to become the world’s fastest-growing major economy would crown Trump’s confrontational diplomacy with success.’ Its conclusion was the same hope as the Wall Street Journal, that economic policies could be imposed by the US on China which would weaken the position of the Communist Party: ‘Trump’s hopes of winning genuine structural changes in China’s economic model are colliding with…. preserving Communist Party control.’

This geopolitical goal, disguised as an economic one, is adopted because US anti-China forces accurately understand that the CPC is the core of the People’s Republic of China (PRC) and the rejuvenation of the Chinese nation. Therefore, anti-China forces believe that, in the same way that the overthrow of the CPSU led to the collapse of the USSR, and a historic geopolitical catastrophe for Russia, if they could weaken the CPC then they would be able to impose a similar historic defeat on China – blocking China’s national rejuvenation.

Under those circumstances, when an economic policy is being pursued with a geopolitical goal which is against the interests not only of China but of the world, it is therefore important that there is an accurate understanding of economic forces which are operating. China can no more escape economic laws than any other country. If there is an accurate understanding of the economic forces operating, there will therefore be the greatest ability to deal with any negative pressures from outside China. Equally, if there is a misunderstanding of the economic processes operating, rhetoric or effort will not be able to avoid the negative consequences.

Valuable articles by other economists have concentrated on questions such as demand management while the focus of this article is the medium/long term supply side of China’s economy. These two approaches are not contradictory – both demand and supply sides of the economy must be analysed, and demand measures may in an important number of cases be more rapid in their effect. It should simply be noted that in the medium/long term the supply side of the economy dominates and in the shorter-term demand measures must necessarily operate through creating changes on the supply side. That is, to produce changes in economic growth, demand must lead to changes in economic inputs – changes in demand which do not affect supply side inputs may produce inflation or deflation, but they do not produce changes in economic growth. Therefore, it is also necessary to analyse the supply side in order even to assess the impact of demand side measures. This article’s aim is to therefore to analyse in a quantified way the fundamental supply side forces operating in China’s economy.

China’s per capita GDP growth is the fastest of any major economy

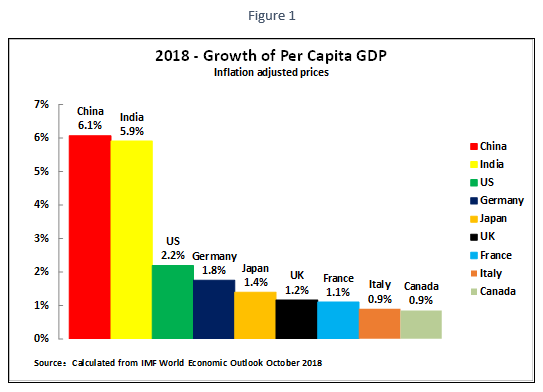
To avoid any misunderstanding in what follows, it is necessary to have a strictly balanced analysis of the situation of China’s economy. In 2018 China had the fastest per capita GDP growth of any major economy – a position it has held for decades. Figure 1 shows that on the IMF’s estimates China’s per capita GDP growth in 2018 was 6.1% compared to India’s 5.9%, 2.2% in the US, 1.8% in Germany and 1.4% in Japan. As analysed below the fact that China’s population growth is now significantly lower than India, the US, the UK, and Canada, to make comparisons simply among major and G7 economies, necessarily affects China’s ranking as measured by total GDP growth. But the well being of China’s population depends more on per capita GDP than on total GDP. To take one example, even if India’s official GDP figures are accepted, and they are not by many experts even in India, China’s per capita GDP growth is still faster than India’s – and China’s per capita GDP growth is almost three times as fast as the US, more than three times as fast as Germany, and more than four times as fast as Japan. Talk in the Western or Chinese media that China’s economy is in ‘deep crisis’ is therefore merely empty propaganda – as with similar claims made for decades. Furthermore there is no reason to believe that either in the short or medium term such a crisis will develop – China has the strongest macro-economic mechanisms in the world for preventing a severe economic slowdown, as analysed in my book 别误读中国经济 (‘Don’t Misunderstand China’s Economy’). The issues in this article therefore do not to deal with such non-existent ‘crises’ but primarily deal with clarifying medium/long term issues on which it is important to avoid conceptual or factual confusion.

Testing explanations of China’s economic slowing

There are currently three popular explanations of China’s economic slowing appearing in the media which are examined here against the test of facts.

  • That the slowing of China’s economy is due to lack of proper market mechanisms, a claimed negative effect of SOEs in the economy etc.
  • That China’s economic slowing is due to demographic factors, a slowing of the growth of the working age population followed by its slow decline.
  • That China’s economic slowing is due to a decline in capital inputs.

These explanations, as will be seen, are not mutually exclusive. However even when more than one process is operating it is crucial to find out which are the most powerful – as only by dealing with the most important of these can an adequate policy response be developed.

The conclusions arrived at from study of the facts are clear:

  • Demographic factors play some, but a small, role in the slowing of China’s economy.
  • Factors such as inefficient market mechanisms, or SOEs play essentially an insignificant role in China’s economic slowing – although maintaining the efficiency of market mechanisms is crucial to prevent an excessive slowing of China’s economy.
  • The overwhelmingly dominant factor in China’s economic slowing is the decline in capital creation and the fall in net fixed capital investment.

As these issues are crucial for China’s economic development this article examines these issues in a comprehensive way.

The necessity to use the most accurate data

To accurately analyse the processes operating in China’s economy it is vital to use real, and the most accurate possible, data. It is not unusual to see articles in parts of the media, which consists of ‘lists’ of issues without accurately analysing the real weight of each. It is indeed not unusual in parts of the media to see articles which contain no quantified data on trends in the economy but merely non-quantified claims. This is not merely wrong in principle but dangerous. Because by this method even if a real issue is pointed to, then if its real weight in the situation is not measured accurately this can lead to misleading judgements and consequences.

To explain this an analogy can be taken – comparing China’s economic development to a scientist analysing the path of a billiard ball across a flat table. If the scientist has ultra accurate measuring instruments it will be found that the trajectory of the ball is affected by innumerable forces – the gravity of the moon, the gravity of other planets, even the gravity of distant galaxies. The scientist is therefore stating something true if they say, for example: ‘I have found the trajectory of the billiard ball is affected by the gravity of the planet Mars.’ But, unfortunately, emphasising this true statement can lead to pseudo and misleading arguments. Because, if the scientist focuses only on the effect of Mars’s gravity on the billiard ball or says, ‘the trajectory of the ball is affected by the gravity of Mars, this is therefore the big issue to analyse’ or does not mention other forces, they are saying something fundamentally untrue – by far the most powerful force acting on the ball is the gravity of the planet Earth. Therefore, a statement which is true can be deeply misleading if its real weigh in the situation is not calculated.

This principle strongly applies to economic development. Innumerable factors affect economic growth, but it is necessary to accurately measure which are the most powerful and which less powerful. It was to accurately measure the weight of different factors in economic growth that the key tools of factual economic analysis were developed – growth accounting, national accounts statistics etc.

The practical consequences are obvious. If emphasis is placed on dealing with the less powerful factors in economic development, then even success in tackling these will not deal adequately with problems nor take advantage of economic opportunities. Only if the most powerful forces in economic development are dealt with can economic problems be solved, and opportunities successfully taken advantage of.

For this reason, this article concentrates on factually analysing the most powerful factors in the China’s economy – the policy implications are examined at the end of the article.

Growth accounting

The most accurate modern method to calculate the weight of different causes of economic growth is ‘growth accounting’ as originally developed by Robert Solow. Solow’s original formulation, however, suffered from two errors – it did not calculate the effect of changes in the quality of labour (education, training etc) and it did not calculate changes in the quality of capital (reflected in different rates of depreciation of capital). The necessary corrections to these measures were therefore subsequently introduced and adopted by the statistical services of the US, OECD and other international organisations.

Growth accounting analyses GDP growth in terms of three inputs – capital, labour, and total factor productivity (TFP). GDP is therefore:

GDP = capital inputs + labour inputs + TFP

TFP is defined as that part of GDP growth which cannot be explained by either capital or labour inputs.

Using a growth accounting framework, the real importance of popular explanations of the slowing of China’s economy can be easily factually analysed in terms of their effect on economic inputs.

  • If the argument is accurate that slowing of China’s economy is due to lack of proper market mechanisms, a negative effect of SOEs etc., this would show in a slowing of TFP growth – as market efficiency, the existence of SOEs etc are issues of efficiency/productivity not issues of capital or labour inputs.
  • If the argument that China’s economic slowing is due to demographic factors is accurate, i.e. due to negative shifts in the growth of working age population, this would be reflected in a slowing of labour inputs.
  • If the explanation is correct that China’s economic slowing is due to a fall in investment this would be reflected in a decrease in capital inputs.

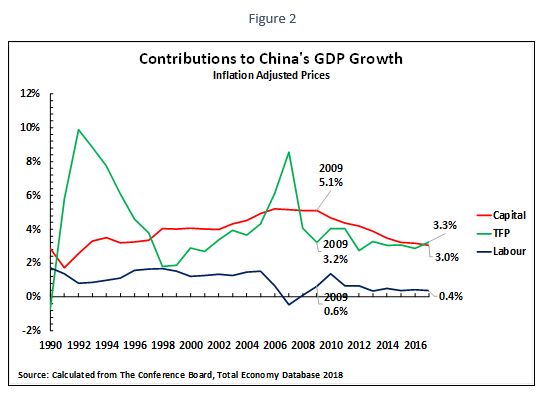
To analyse the factual situation regarding these inputs into China supply side, Figure 2 therefore shows the trends in China’s capital inputs, labour inputs, and TFP since 1990. As China’s response to the international financial crisis, and the framework for analysing the slowing of its economy, may be considered as starting in 2009 therefore the focus is comparing the situation in that year with the latest available data.

The key facts from growth accounting are clear. Between 2009 and 2017 China’s GDP growth fell by 2.3%. Breaking this down in detail:

  • There was a small reduction in labour inputs, almost certainly primarily due to demographic factors, which diminished GDP growth by 0.2% a year. Calculated as proportion of the total slowing in China’s economy, 11.6% of the deceleration in GDP growth is due to the decline in labour inputs.
  • There has been essentially no change in TFP growth – calculated to two decimal points TFP contributed 3.23% GDP growth in 2009 and 3.26% in 2017 (the increase from 3.2% to 3.3% in Figure 2 is merely due to a changing in the rounding of decimals).
  • The reduction of capital inputs into China’s economy was from creating 5.1% GDP growth in 2009 to 3.0% GDP growth in 2017 – i.e. the fall in capital inputs reduced China’s GDP growth by 2.1%. The growth of GDP due to capital inputs fell by 41% between 2009 and 2017, accounting for 89.6% of the decline in GDP growth.

Therefore, evaluating the various popular theories regarding the slowdown in China’s GDP growth:

  • The overwhelming factor in the fall in China’s GDP growth was the decline in capital inputs – which accounted for almost 90% of the decline in China’s GDP growth.
  • There was a fall in labour inputs, primarily due to demographic factors, but this accounted for only slightly over 11% of the decline in China’s GDP growth.
  • There was no significant change in China’s TFP growth – i.e. there is no evidence that the slowdown in China’s economy was primarily due to deterioration in market efficiency, or a negative role of SOEs, all of which would show up as a decline in TFP growth.

In summary, the overwhelming reason for the slowing of China’s GDP was a fall in capital inputs, which accounted for about nine tenths of the decline; there was a contribution from demographic factors, accounting for approximately one tenth of the fall in GDP, and there was no significant indication the slowdown was due to a decrease in market efficiency or the role of SOEs – which would show as a decline in TFP.

Fall in labour inputs- demography

Having examined the overall factual data, applying the famous Chinese dictum of ‘seek truth from facts’, the significance of the individual processes affecting the slowing of China’s economy may now be seen.

The first is that it is true that demographic factors play a role in China’s economic slowing – but it is a small one, accounting for only slightly over one tenth of the decline in the growth rate. Therefore, arguments that the slowing of China’s economy are primarily due to demographic factors, in the most extreme version that ‘China will get old before it gets rich’ will not withstand factual examination. As will be noted below this conclusion from growth accounting is fully confirmed by national accounts calculations – leaving no doubt as to the factual situation.

In terms of a precise analysis, it would theoretically be possible to maintain labour inputs even within existing demographic trends – this could be achieved by methods such as raising the retirement/pension age, by increasing the education and skill of the labour force etc. However, these would either involve very major social changes, e.g. the retirement/pension age is extremely sensitive in all countries, or it would require very large expenditures – for example, in expanding the education and training system. Some measures in these fields are therefore to be anticipated but it is improbable that these could fully offset demographic trends.

Therefore, it is accurate to state that some slowing of China’s growth rate due to demographic factors will occur. But the factual data shows that this has been a relatively small factor in China’s economic slowing. Claims such as that ‘China will get old before it gets rich’ are highly exaggerated as the facts show that trends in labour inputs/demography account for only a small proportion of China’s economic slowdown.

A relevant conclusion from demographic trends, however, is that slow growth of China’s population confirms that the most relevant criteria for measuring China’s comparative economic development is per capita GDP. China’s 0.5% population growth in 2018, is significantly slower than India’s 1.3% or the US’s 0.7%. But the economic wellbeing of China’s population is more directly related to per capita GDP than to total GDP. Data showing that China has the most rapid per capita GDP growth of any major economy was given at the beginning of this article.

TFP

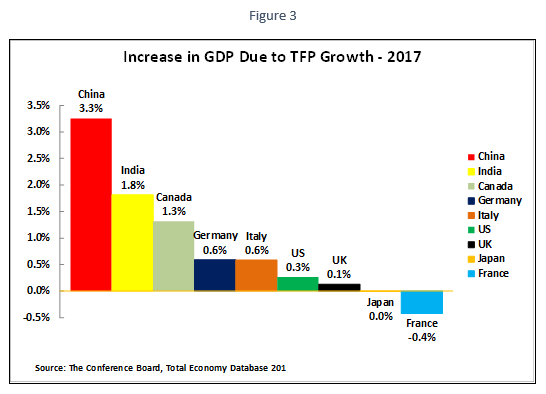
The application of up to date internationally approved methods of measuring the causes of economic growth, as noted above, shows clearly that it is a decline in capital inputs which is primarily responsible for the slowing of China’s economic growth – and not factors such as the role of SOEs or lack of market efficiency. Nevertheless, this does not mean that factors which affect TFP are not significant. Indeed, one of the reasons for China’s extremely rapid per capita GDP growth is its very rapid growth of TFP – by far the fastest for any major economy. Figure 3 shows that in 2017, the latest year for which there is data, China’s increase in GDP due to TFP growth was 3.3% compared to 1.8% in India, 1.3% in Canada, and 0.6% in Germany – the equivalent figure in the US was only 0.3%.

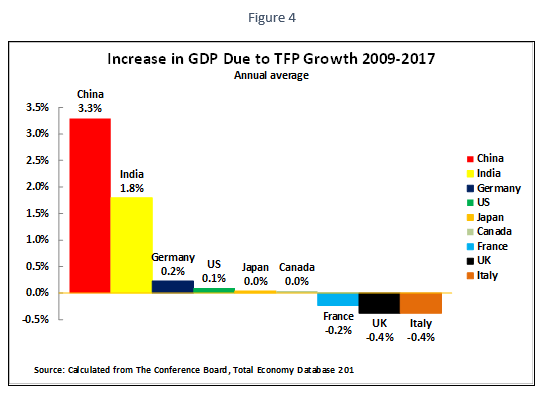
To confirm that China’s rapid TFP growth was not merely due to the specific situation in 2017, Figure 4 shows the annual average increase in GDP due to TFP growth for the major economies for the period 2009-2017. This shows no difference to the figure for 2017 for China of 3.3% and India at 1.8%. But the TFP growth in the G7 economies in this period was far lower – only 0.2% in Germany and 0.1% in the US, while in three G7 countries TFP growth was actually negative.

Numerous implications flow from these international comparisons. But one of the most important is that it is unrealistic to believe that China can accelerate its GDP growth by increasing its rate of TFP growth. On the contrary, China’s rate of TFP growth is so much higher than other major economies that it will take considerable effort to prevent China’s rate of TFP growth falling, with negative consequences for its overall economic growth rate. However, as the relation of TFP growth and economic growth is misunderstood in parts of China’s media, and it is suggested that a policy attempting to increase TFP growth is an alternative to one based on maintaining capital inputs, this issue will be examined in detail.

TFP growth is pro-cyclical

Analysing the slower TFP growth in the G7 economies during the period 2009-2017, compared to the sustained TFP growth in China and India, relates to a feature of TFP growth which is crucial for China. It is sometimes suggested in sections of the media that China should follow a strategy of slower GDP growth in order to focus on increasing TFP. There are several errors in such a concept, but one of the most significant is that it simply will not work practically because international studies, and analysis of China, show that TFP growth is ‘pro-cyclical’ – i.e. faster GDP growth leads to faster TFP growth while slower GDP growth leads to slower TFP growth.

This situation is clear from both international comparisons and data for China itself. The OECD publishes regular systematic international comparisons of TFP growth, all of which confirm that TFP is ‘pro-cyclical’ – i.e. TFP growth increases when the economy is speeding up and TFP growth declines when the economy is slowing down. Therefore, slowing China’s economy would be expected to lead to slower TFP growth not faster.

The OECD uses the term Multi-Factor Productivity (MFP), instead of the term TFP utilises by Solow and other creators of economic growth accounting, but the concept is identical. The conclusion of the OECD in its Latest 2018 report is unequivocal: ‘multifactor productivity growth (MFP) behaves cyclically, i.e. it increases in upturns and declines in downturns… The empirical evidence confirms the cyclical pattern of MFP. In fact, MFP follows GDP growth very closely, not only in terms of direction but also in terms of the size of the change.’ This confirms the finding of all previous OECD studies – as shown in the appendix to this article.

One reason some writing in the media has failed to note this ‘pro-cyclical’ behaviour of TFP is that it erroneously believes TFP represents ‘technological change’ – which would not be expected to show a cyclical behaviour. But such a view is a misunderstanding of what TFP measures. As the OECD notes in the 2017 edition: ‘After computing the contributions of labour and capital inputs to output growth, the so‐called multifactor productivity can be derived. It measures the residual growth that cannot be explained by changes in labour and capital inputs and represents the efficiency of the combined use of labour and capital in the production process. Multifactor productivity is often perceived as a pure measure of technical change, but, in practice, it should be interpreted in a broader sense… Changes in multifactor productivity reflect also the effects of changes in management practices, brand names, organisational change, general knowledge, network effects, spillovers from one production factor to another, adjustment costs, economies of scale, the effects of imperfect competition and measurement errors.’

TFP growth in China

It follows from these general international comparisons that allowing slowing of China’s economic growth will be accompanied by slowing TFP growth. But it is, of course, also necessary to check that this general international finding also applies to China.

Analysis of the correlation of TFP growth and GDP growth in China confirms that it is fully in line with the international findings of the OECD given above – i.e. the speeding up of GDP growth is correlated with increasing TFP growth, and a slowing GDP growth is correlated with slowing TFP growth.

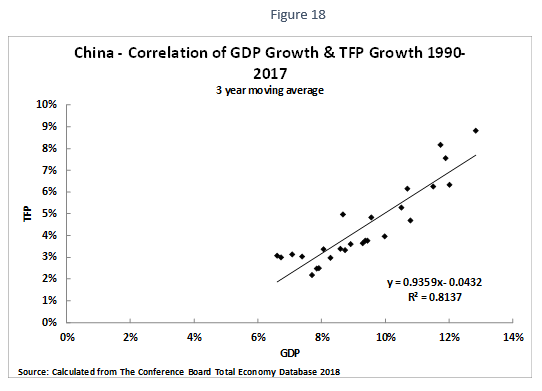
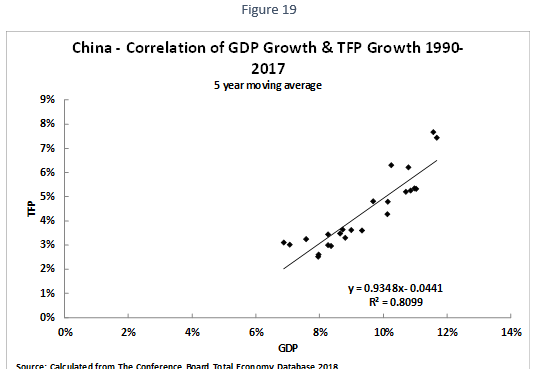
Figure 5 shows the annual correlation between China’s annual GDP growth. This correlation, of 0.85 is extraordinarily high and fully in line with the OECD’s international conclusions. To cross check that this correlation is not due to purely short term factors, in the appendix to this article Figure 18 shows the correlation of China’s GDP growth with TFP growth using a three year moving average, and Figure 19 uses a five year moving average. The correlations shown, 0.81 in both cases, are also extraordinarily high. The conclusions of this are therefore clear. There is nothing unusual in China’s economic development – it is in line with international data. As with other countries its TFP growth is pro-cyclical. Therefore, any policy based on slowing China’s economy to attempt to accelerate TFP growth will not work as this will exert downward pressure on China’s TFP growth. On the contrary, it follows from the pro-cyclical character of TFP growth that it is an upturn, an acceleration in China’s economic growth, that aids increased TFP growth.

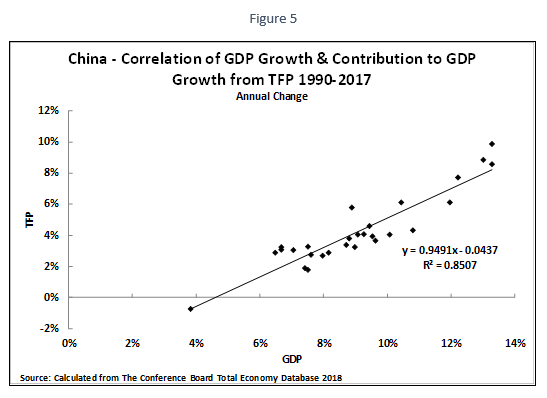
It may, of course, be noted that correlation is not the same as causation. The fact that fast GDP growth is correlated with fast TFP growth does not prove that fast GDP growth causes fast TFP growth, or that fast TFP growth causes fast GDP growth, or that some other factor(s) causes both fast GDP growth and fast TFP growth. But for present purposes it should be noted that it is unnecessary to establish the direction of causation. It is merely necessary to note that the correlation of the speed of GDP growth and of the rate of increase of TFP is over 80%. Such a high correlation means that faster TFP growth cannot be achieved without faster GDP growth.

Therefore, the perspective that there can be fast TFP growth without fast GDP growth is unrealistic – whether considered from the point of view of international comparisons, as studied by the OECD, or whether considered in the specific case of China. Even less realistic is the idea that TFP growth can be accelerated while GDP growth slows.

It should be clearly noted from this that it does not follow that slower GDP growth may not help in achieving other ‘quality’ targets. For example, China has achieved notable success in environmental improvements, in lowering pollution and reducing energy consumption per unit of GDP. Achieving these targets may be achieved through slower GDP growth. However, it is clear from both international comparisons and the experience of China that slower GDP growth will not aid in achieving high TFP growth. On the contrary both international experience and that of China shows slow GDP growth will lead to slower TFP growth.

Alternative estimates of growth inputs

It should be noted that the above data uses China’s official calculation of its growth rate. Attempts are sometimes made in the West to claim that China’s real GDP growth is systematically exaggerated and in reality is far lower than the official data – although top Western experts who have examined this such as Tom Orlik, whose Understanding China’s Economic Indicators is the most thorough study of China’s economic statistics, do not agree with this assessment. Most such Western claims are unsystematic and such methods therefore cannot be used to thoroughly examine China’s growth. However, one systematic attempt to examine China’s growth using modern growth accounting methods, with a claim that China’s growth is much slower than its official data, has been made – by Harry X. Wu of the Institute of Economic Research, Hitotsubashi University, Tokyo. This claims that between 2009 and 2017 China’s annual GDP growth fell from 7.9% to 3.7%. But this also finds that the overwhelming reason for this claimed slowdown was due to decline in capital inputs. Wu’s calculations show that between 2009 and 2017 annual GDP growth due to labour inputs fell by 0.1%, annual GDP growth due to TFP fell by 0.1%, but annual GDP growth due to capital inputs declined by 3.9%.

Therefore, even if it is claimed that China’s GDP growth is lower than official data, use of modern growth accounting data shows that the overwhelming reason for the slowdown in China’s economy is not due to changes in TFP or demography but due to a decline in capital inputs.
 

National accounts data

So far modern growth accounting data has been used for analysis – growth accounting is necessary if TFP is to be calculated. This showed that the overwhelming reason for the slowing of China’s economy is the decline in capital inputs. However, while growth accounting is the most accurate method of calculating contributions to changes in GDP there are strong reasons for cross checking the results with other statistical data:

  • If other data, for example national accounts statistics, corroborate the findings of growth accounting this would strongly confirm the certainty of the findings.
  • Growth accounting requires a great deal of data for computation. There is therefore a delay in such data becoming available – such data for China is only available to 2017. More data for China is, however, available from other statistical sources.

As other such data is less accurate than growth accounting, if changes that other statistics demonstrated were small in scale, or contradicted growth accounting data, then it might create difficulties to interpret the results. Fortunately for present purposes, however, examination of national accounts and other statistics shows trends which are not small in scale and are fully in line with growth accounts data – they therefore confirm the findings of growth accounting. Such confirmation of trends by two different statistical methods, of course, strengthens confidence in the findings. Therefore, in order to evaluate the impact of changes other statistical sources will also be considered

The limited effect of demographic changes

The first trend which is confirmed by use of statistical sources other than growth accounting data is the negative but relatively small effect of demographic changes.

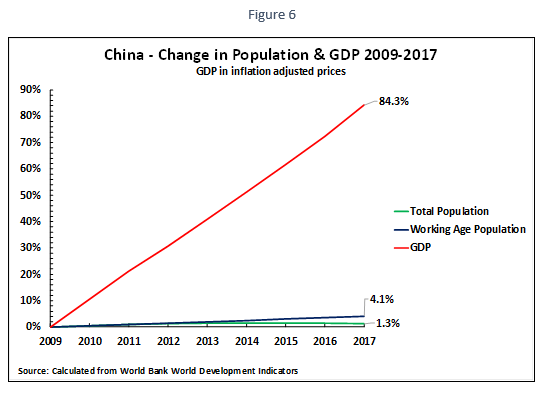
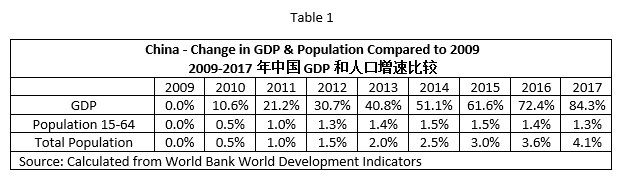
It was already noted that China’s retirement/pension age is very low by international standards – which represents a policy/social choice. The international definition of working age population is 15-64 years. By this criteria Figure 6 and Table 1 show that between 2009 and 2017, the latest available data, China’s internationally defined working age population rose by only 1.3%, and China’s total population rose by 4.1%, whereas China’s GDP rose by 84.3%. China’s GDP therefore rose 66 times as fast as China’s working age population and 20 times as fast as China’s total population.

In summary, China’s population increase played a negative but small role in China’s GDP growth. Similarly, therefore, the decline in China’s working age population, which reached a peak in 2015 at 1.5% above its 2009 level and by 2017 had fallen to 1.3% above its 2009 level, will play only a small role in slowing of China’s economic growth. The conclusion of growth accounting data is therefore confirmed by other sources. Demographic factors will play a negative role in China’s GDP growth, but this effect will be small. Claims such as ‘China will grow old before it grows rich’ are based on gross exaggerations and have no serious factual basis. The primary source of any slowing of China’s GDP slowing must therefore be sought in entirely different factors than demographic ones. The fact that both growth accounting and other data leads to exactly the same conclusion leaves no doubt as to the factual situation.


Fall in Net Capital Creation

Turning to capital inputs, national accounts data fully confirms the fall in China’s capital inputs shown by growth accounting. Figure 7 shows that China’s net fixed capital creation (i.e. gross fixed capital formation minus depreciation) fell from 30.5% of GDP in 2009 to of 21.5% of GDP in 2016 (the latest available internationally comparable data) – this is a very large 9.0% of GDP fall.

Indeed, at a first approximation the relation between the reduction in China’s net investment and the slowing of the economy is even rather mechanical. In 2009-2016 China’s annual GDP increase fell from 9.4% to 6.7%. This is a reduction of 29% compared to the initial figure, while net fixed capital formation fell from 30.5% of GDP to 21.5% – a reduction of 29% compared to the initial figure.

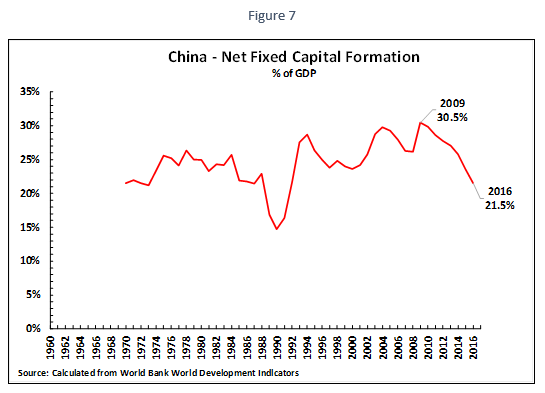
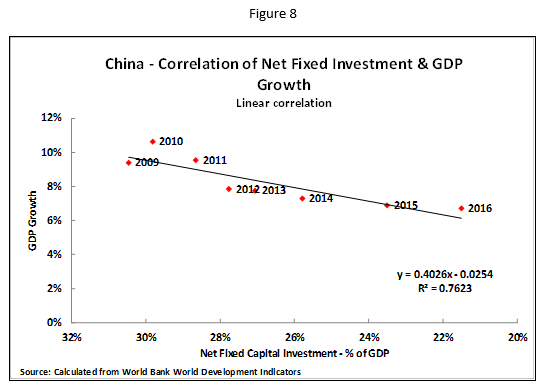
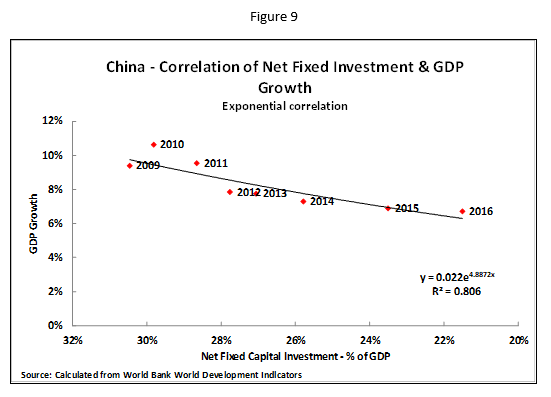
Figure 8 fully confirms the extreme closeness of the correlation between the decline in China’s net fixed capital formation and the slowing in GDP since 2009. The linear correlation is 0.76, by itself extremely high. However, there is no necessity for a correlation to be linear and Figure 9 shows that the non-linear correlation is 0.81 – extraordinarily high.

The usual caveat that correlation by itself does not establish causation is irrelevant here, as the extremely high correlation shows that it is not possible to increase China’s GDP growth without increasing the percentage of net fixed capital formation in GDP – and that any decline in the percentage of China’s net fixed investment in GDP will be accompanied by an economic slowdown. The extremely close correlation between net fixed investment and economic growth shown by the national accounts data is therefore fully in line with growth accounting calculations analysed earlier. Capital inputs are overwhelmingly strongly correlated with China’s economic growth.


Gross capital formation and depreciation

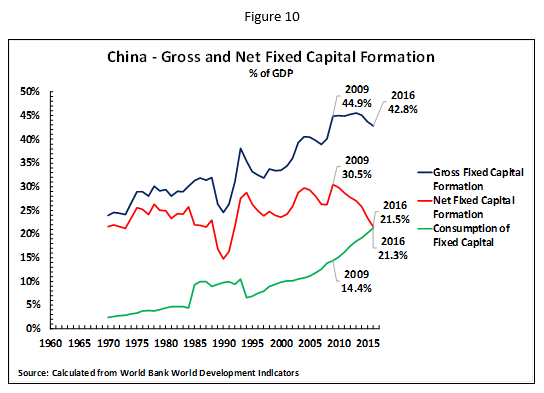
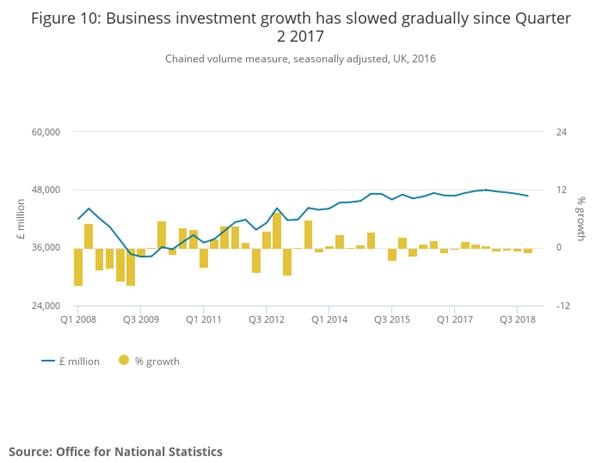
If the reason for this sharp fall in China’s net capital formation is now analysed further Figure 10 shows this is due to two processes. On World Bank data:

  • Approximately one quarter, 24%, of the fall in the proportion of net fixed capital formation in China’s GDP is due to the decline in the percentage of China’s GDP devoted to gross fixed investment – which dropped from 44.9% of GDP in 2009 to 42.8% of GDP in 2016.
  • Approximately three quarters, 76%, of the fall in the proportion of net fixed capital formation in China’s GDP is due to a rise in fixed capital consumption (depreciation) in China’s GDP. This is strongly affected by the rise China’s capital stock – capital consumption as a percentage of China’s GDP rose from 14.4% of GDP in 2009 to 21.3 of GDP in 2016.

It should be noted that an increase in consumption of fixed capital/depreciation in GDP is a normal process resulting from an increase in and modernisation of capital stock – it also occurs in the US. However, the increase in the percentage of GDP ascribed to capital consumption/depreciation in China is extremely high in terms of international comparisons. It would therefore be important for studies to be carried out to see if this figure is accurate or exaggerated. Nevertheless, the present data is so high that it indicates that capital consumption/depreciation is a significant factor in China fall in net capital creation – making it important to analyse net fixed capital creation and not only gross investment.

The most recent trends in fixed investment

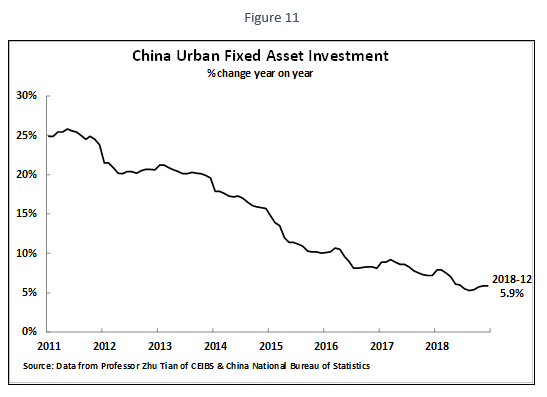
Data for China’s gross fixed capital formation using national accounts data is available to 2017, and for net capital formation to 2016. However, data for 2018 for these categories will not be available for some time. Nevertheless for 2018 statistics for year on year changes in urban fixed asset investment leave no doubt that the same trend has continued. Figure 11 shows that the annual increase in China’s fixed asset investment fell from 7.2% in December 2017, and 8.1% in December 2016, to 5.9% in December 2018. As this latest figure is significantly below China’s growth of GDP at current prices in 2018 it is extremely likely that the percentage of fixed investment in China’s GDP declined in 2018 – continuing the trends in a fall in capital inputs shown in national accounts data. This trend then turned around in the first quarter of 2019, with a rise to a 6.3% year on year increase in fixed investment. Underpinning the improved economic trends in that period.

Saving

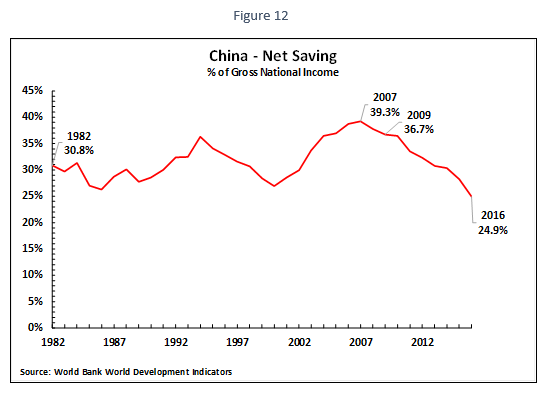
Turning from changes in fixed investment to overall trends in China’s capital creation/saving, which is necessary to finance investment, the same trends can be seen – only in an even more extreme form. It should be noted for clarity that throughout this article by ‘saving’ is meant China’s total savings – the sum of household saving, corporate saving, and government saving – and is not only household saving.

Figure 12 shows that China’s net saving, which is equivalent to China’s net capital creation, fell from a peak of 39.3% of Gross National Income (GNI) in 2007, to 36.7% of GNI in 2009, to 24.9% of GNI in 2016 – i.e. a decline of 11.8% of GNI in 2009-2016, and 14.4% of GNI in 2007-2016. This extremely large fall in the percentage of net saving in China’s economy, a large decline in the capital supply, is necessarily a strongly negative supply side shock for China’s economy.

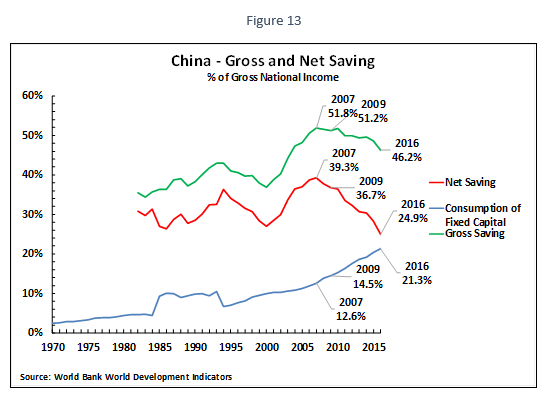
Analysing in greater detail this major fall in China’s net saving, i.e. net capital inputs, again shows this is due to two processes:

  • China’s gross saving fell from 51.2% of GNI in 2009, and a peak of 51.8% of GNI in 2007, to 46.2% of GNI in 2016. This accounted for 42% of the fall in China’s net saving between 2009 and 2017.
  • Capital consumption has risen from 14.5% of GNI in 2009, and 12.4% of GNI in 2007, to 21.3% of GNI in 2016. This accounted for 58% of the fall in China’s net saving between 2009 and 2017.

As already noted, estimates of savings/capital consumption are difficult to calculate but the changes shown are so large as to leave no doubt as to the general trend. There has been a sharp reduction in the proportion of China’s economy devoted to net capital creation.

This measured trend, paralleling the decline in capital inputs measured by growth accounting, is equivalent to a severe negative supply side shock to the economy. It is as though the petrol was drained out of the fuel tank of a car, making it inevitable that the car will not run for the same distance as before. Anyone expressing surprise that the car will not run as far as before is simply going against the laws of physics. Put in economic terms what has occurred is a reduction in the capital supply to China’s economy which is clearly confirmed by both growth accounting and national accounts data. As capital is one of the key inputs to the economy, such a reduction will necessarily produce economic slowing.

The correlation of China’s saving and economic growth

It was earlier shown that the correlation between China’s net fixed investment and its rate of GDP growth was extremely high. Net fixed investment is that part of China’s capital creation used for increases in fixed investment/capital stock in China. However, while fixed investment accounts for by far the largest part of use of China’s savings (gross fixed investment is approximately nine tenths of the use of China’s capital creation) small parts are used for other purposes – accumulation of inventories or as the surplus in China’s balance of payments. Therefore, for exactitude it is important to also study the correlation between China’s total capital creation/saving and GDP growth.

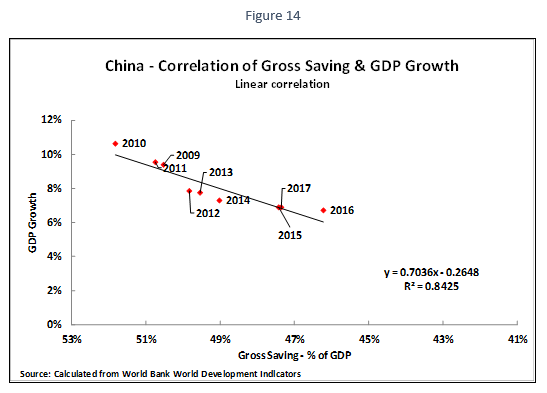
Such analysis is extremely revealing. It shows that the correlation between China’s capital creation/saving and its economic growth is even closer than between net fixed investment and economic growth. Furthermore, there is an extremely strong correlation between China’s gross savings and its GDP growth – whereas the correlation between China’s gross fixed investment and economic growth is low. This is statistically highly useful as it avoids the issue noted above that the calculated consumption of fixed capital/depreciation in China is very high compared to other countries. The fact that an extremely strong correlation of China’s gross capital creation/saving with GDP growth exists, as well as between net capital creation/saving and GDP growth, means that any complications of calculating capital consumption/depreciation can be avoided. Analysing first the linear correlation of gross saving and economic growth this is shown in Figure 14. This correlation of 0.84 is extremely high.

However, as already noted there is no necessity for a correlation to be linear. Figure 15 shows that the non-linear correlation is of gross saving and 0.87– an extraordinarily high correlation. As before the caveat that correlation does not establish causation is irrelevant as the extremely high correlation shows that it is not possible to increase China’s GDP growth without increasing the percentage of gross saving in GDP – and that any decline in the percentage of gross saving in GDP will be accompanied by an economic slowdown.
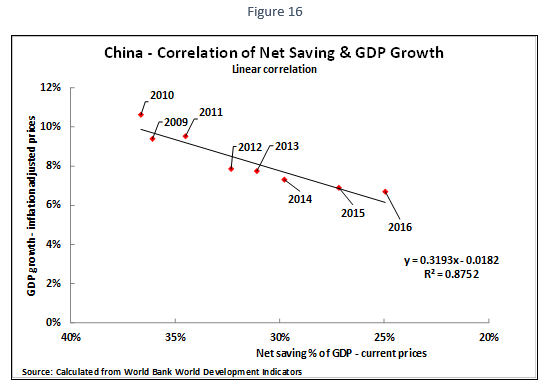
Turning to net saving, Figure 16 shows that the linear correlation of the percentage of net saving in China’s GDP with its economic growth is 0.88 – an ultra-close connection.
 
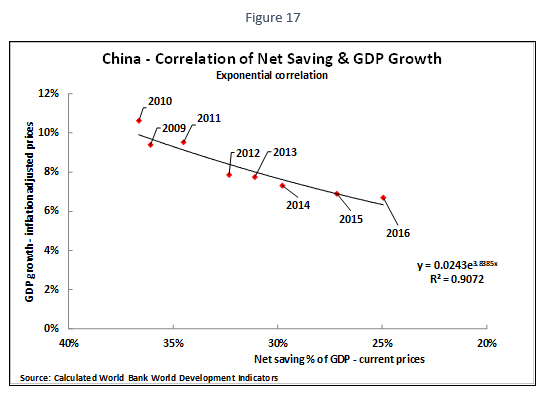
Turning to the non-linear correlation of the percentage of net saving in China’s GDP and its economic growth Figure 17 shows that this is 0.91 – an extraordinarily high correlation.

Once again the usual caveat that correlation does not establish causation is irrelevant as this extremely high correlation shows that it is not possible to increase China’s GDP growth without increasing the percentage of net saving in GDP, and that any decline in the percentage of net saving in GDP will be accompanied by an economic slowdown.

Capital creation and China’s economic growth
As it may be seen that the correlation between China’s capital creating/savings and economic growth is even closer than between net fixed investment and economic growth, it may be asked why this is the case?
This difference is not of crucial importance for economic policy, as both correlations are extremely high, confirming that it is capital creation which is the dominant issue in China’s economic growth. But it may be noted that China’s total supply of capital, measured by capital creation/savings affects other features of the economy than fixed investment. For example, a reduction in capital creation will necessarily produce negative consequences in specific markets – upward pressure on interest rates, decreasing profitability of companies, increase in leverage due to the fall in company profitability etc. These other negative effects of the fall in capital creation/saving may explain why the correlation of this with China’s economic growth is even stronger than the relation to fixed investment.
Conclusion
As emphasised at the beginning of this article there is no ‘deep crisis’ in China’s economy – China’s per capita GDP growth continues to be the fastest of any major economy in the world. This is the crucial international framework to understand. Within that overall perspective the conclusion of both modern growth accounting and national accounts measures regarding why China’s economy has slowed are the same.
  • The overwhelming cause of the slowing of China’s economy is a fall in capital/investment creation. This is shown in growth accounting by the fact that almost nine tenths of the decline in GDP growth is due to a fall in capital inputs. In national accounts data it is confirmed by the extraordinarily high correlation between net fixed investment and GDP growth of 0.81, of a correlation between gross saving and GDP growth of 0.87, and a correlation between net saving and GDP growth is 0.91 – all extraordinarily high figures.
  • Demographic trends will reduce labour inputs, slowing the economy, but this effect only accounts for a small part of economic deceleration – macro-economic data shows that increased labour inputs created only a small part of China’s growth, while growth accounting shows a fall in labour inputs accounts for only about one tenth of the slowing of China’s economy.
  • Growth accounting data shows that China’s TFP growth is high in terms of international comparisons – meaning it is very unlikely that China’s GDP growth can be accelerated by an increase in TFP, but that measures will have to be taken to ensure China’s TFP growth does not fall.

It is necessary to be aware of the full scale of this negative supply side shock in terms of capital creation. The decline in China’s net fixed capital investment is 9% of GDP on World Bank data. Even if the statistics on capital depreciation merit further evaluation, given their extremely high level by international standards, even measures of gross savings, which do not rely on calculation of depreciation, has fallen by 5.0% of GDP. Either figure is a severe negative supply side shock – confirming the growth accounting data which shows a sharp fall in capital inputs.

To return to the beginning of this article, the focus here is on medium/long term factors in China’s economic development. This is not contradictory to a shorter-term emphasis on demand management or supply side measures already taken to close excess capacity. However, to note again, measures affecting the demand side of the economy must necessarily operate through their impact on the supply side i.e. to produce changes in economic growth demand must create changes in labour inputs, capital inputs or TFP. Changes in demand which do not affect the supply side inputs may produce inflation or deflation, but do not produce changes in economic growth.

The consequences of this factual situation of the weight of factors in China’s economic development for economic policy are clear. As for reasons already stated TFP will be at best neutral, and demographic trends will be moderately negative, the only key input which can positively influence China’s growth rate is the level of capital inputs. This means that policies which affect capital inputs into China’s economy, that is investment, can have a powerful effect in lowering, sustaining or raising China’s economic growth rate.

This quantitative situation therefore also necessarily determines the practical efficacy of measures designed to limit China’s economic slowdown and/or to carry out any economic stimulus.

  • Measures to maintain or increase market efficiency are important to try to sustain China’s rate of TFP growth but they not quantitatively able to prevent an economic slowdown – for the reasons given it is extremely improbable China could increase its level of TFP growth given its present high level. Furthermore, a strategy, which is sometimes proposed that China should allow its economy to slow but increase its TFP growth will not work for the quantitative reasons outlined – TFP growth is pro-cyclical and therefore a slowdown in economic growth will lead to a slowing of the TFP growth.
  • Demand side measures to increase consumption will only be successful, for the reasons already outlined, if they produce changes on the supply side – that is, primarily if they affect capital inputs.
  • Measures to cut company taxation are useful in maintaining employment and other goals but for the quantitative reasons analysed above they will only translate into faster economic growth if they lead to an increase in capital inputs – that is investment.
  • In summary, given the quantitative situation analysed with demography/labour inputs and TFP, only measures which directly increase capital inputs, that is either state or private investment, will be significantly beneficial to the economic growth rate.

Practical application of policy will necessarily confirm the trends analysed. While measures such as increases in the retirement/pension age, and increases in training and education, may decrease the negative effect of demographic changes no significant body of opinion believes that a significant increase in China’s growth rate can take place due to an increase in labour inputs. There are those who argue that China’s growth could be increased due to an increase in TFP, but for the quantitative reasons given this will not be successful. For quantitative reasons the only method that will stabilise/increase growth will be an increase in capital inputs.

Postscript

This article was written to analyse in detail the slowing of China’s economy in the latter part of 2018. But its conclusion, that it is the level of investment which controls the rate of growth of China’s economy, applies equally to the good results for the first quarter of 2019. The fall in investment in 2018 led to economic slowing, the rise in investment in the first quarter of 2019 led to stabilisation in GDP growth and acceleration in other economic measures. Therefore, from both angles the data fully factually confirms that it is fixed investment which is the most powerful factor affecting China’s speed of economic development.

Appendix

This appendix is intended for economic specialists – non-specialists should know that it does not add to the main conclusions of the article. It merely indicates further substantiating evidence and explanations regarding the points in the article.

First regarding growth accounting, it is important to note the official improvements in the methods of measuring economic growth and its causes which have been formally adopted by the UN, OECD, and other statistical agencies – it is a serious problem in some literature in China that methods of measuring economic growth and its causes which are no longer accepted are used. The reasons for these changes in the official methods of calculating economic growth and its causes are analysed in detail in 为何联合国、经合组织与美国正式改变其经济增长成因测算方法? (The Copernican Revolution in Analysis of Economic Growth is Very Significant for China). But the clearest fundamental error which had to be corrected compared to former methods of analysing the causes of economic growth was that these did not calculate changes in the quality of capital and labour inputs. This meant in the case of labour, for example, that one hour of work by a South Korean peasant in 1953, who may have been illiterate, was calculated as equivalent to 1 hour of work by a South Korean engineering PhD, and very rapidly depreciating assets such as ICT equipment were not treated differently from assets which depreciated over very long periods of time. These errors are corrected in the new internationally approved methods of calculating the causes of economic growth by:

  1. Calculating separately labour quantity (the number of hours worked) from labour quality (the skill, educational etc qualification of labour);
  2. Using the category of ‘capital services’ to measure the contribution of different types of capital investments (in the OECD methodology eight categories of capital assets are used ‘computer hardware, telecommunications equipment, transport equipment, other machinery and equipment and weapons systems, non-residential construction, computer software and databases, research and development and other intellectual property products.’

In this article data calculated according to these new and approved methods of calculation are used. Regarding the correlation of GDP growth and TFP growth the correlations for single years was shown in the article. However, it is useful and important to show that the same correlation exists over not merely the short but the medium term. Figure 18 therefore shows a three-year moving average for the correlation of TFP and GDP growth and Figure 19 shows a five-year moving average. The three-year correlation is 0.81 and the five-year correlation is also 0.81. Both correlations are extremely high. The caveat that correlation does not establish causation is irrelevant as this extremely high correlation shows that it is not possible to increase China’s TFP growth while reducing China’s rate of GDP growth – that is a strategy of ‘lower GDP growth and higher TFP growth’ will not work.


This finding for China is entirely in line with international experience. In order to avoid overburdening the text with detail for non-specialists only the 2018 OECD finding was cited. However, this is entirely in line with all OECD studies on the issue. To show this reference to the previous OECD studies are therefore given here.

In 2012 the Compendium of Productivity Indicators noted: ‘the empirical evidence confirms the pro-cyclical pattern of MFP. In fact, MFP follows GDP growth very closely, not only in terms of the direction but also the size of the change.’ (OECD, Compendium of Productivity Indicators 2012 p11.) And therefore ‘MFP behaves cyclically, i.e., it increases in an upturn and declines in a downturn.’ (OECD, Compendium of Productivity Indicators 2012 p58.)

The 2013 Compendium of Productivity Indicators had the same finding: ‘multifactor productivity growth (MFP) behaves cyclical, i.e., it increases in an upturn and declines in a downturn. ‘ (OECD, Compendium of Productivity Indicators 2013 p62).And: ‘The empirical evidence confirms the cyclical pattern of MFP. In fact, MFP follows GDP growth very closely, not only in terms of the direction but also in terms of the size of the change. ‘ (OECD, Compendium of Productivity Indicators 2013 p62)

The 2015 Compendium of Productivity Indicators similarly concludes: ‘MFP appears to have moved in a pro-cyclical way’ (p30) And: ‘multifactor productivity growth (MFP) behaves cyclically, i.e. it increases in an upturn and declines in a downturn.’ (OECD, Compendium of Productivity Indicators 2015 p64)

The 2016 report notes ‘The empirical evidence points to the recent slowdown in labour productivity being in at least in part explained by its pro-cyclical pattern, particularly for MFP’ (OECD, Compendium of Productivity Indicators 2016, Kindle Location 61) And: ‘multifactor productivity growth (MFP) behaves cyclically, i.e., it increases in upturns and declines in downturns.’ OECD, Compendium of Productivity Indicators 2016 (Kindle Location 1704-1705).

The 2017 OECD report again finds: ‘multifactor productivity growth (MFP) behaves cyclically.’ (OECD, Compendium of Productivity Indicators 2016 (Kindle Location 1704-1705).And that: ‘The empirical evidence confirms the cyclical pattern of MFP. In fact, MFP follows GDP growth very closely, not only in terms of the direction but also in terms of the size of the change.’ (OECD, Compendium of Productivity Indicators 2017 (Kindle Location 1532).

The OECD’s factual finding is therefore clear and unequivocal. Slowing of GDP growth leads to a slowing of TFP growth. A strategy of ‘slower growth to achieve higher TFP increases’, other things being equal, therefore won’t be successful – a slowing of GDP growth will be associated with slower TFP growth.

* * *

This article was previously published on Learning from China and originally in Chinese at Guancha.cn.